Advertisement

Advertisement

Advertisement

Advertisement

Population Pyramids

A population pyramid graphically illustrates the age and gender Gender Gender Dysphoria distribution of a given population. The shape of the pyramid conveys details about life expectancy, birth, fertility, and mortality Mortality All deaths reported in a given population. Measures of Health Status rates. Additional data that can be extrapolated from a population pyramid include the effects of historical events, economic development, and future demographic trends. This information helps direct plans for the subsequent social and economic needs of a given population.

Last updated: Oct 30, 2024
Editorial responsibility: Stanley Oiseth, Lindsay Jones, Evelin Maza

Advertisement

Advertisement

Advertisement

Advertisement

Advertisement

Advertisement

Overview

Definitions

  • Population pyramid: 
    • Age-gender pyramid
    • A graphical illustration showing the age-sex distribution of a population
  • Birth rate (or crude birth rate): number of live births per 1,000 population in a given year
  • Fertility rate: births per 1,000 women of childbearing age (aged 15–44) in a given year
  • Death or mortality Mortality All deaths reported in a given population. Measures of Health Status rate (or crude death rate Crude death rate Calculated as the ratio of the total number of people who die due to all causes over a specific time period to the total number of people in the selected population. Measures of Health Status): number of deaths per 1,000 population in a given year
  • Life expectancy: average number of additional years a person could expect to live if current mortality Mortality All deaths reported in a given population. Measures of Health Status trends were to continue for the rest of that person’s life

Structure

  • Uses 2 juxtaposed histograms (generally 1 for each gender Gender Gender Dysphoria), turned sideways:
    • Vertical (y-axis):
      • Age of the population
      • Age groups displayed in the central axis
      • Males: left of the vertical axis 
      • Females: right of the vertical axis 
    • Horizontal axis (x-axis): percentage or size of the population
  • Illustrates a series of stacked bars, with each bar representing the population and the age group
    • Youngest age group: represented by the bottom bar
    • Oldest age group: uppermost bar

Uses of the Population Pyramid

Population trends

  • Long-term trends of fertility and mortality Mortality All deaths reported in a given population. Measures of Health Status rates:
    • Fertility rate:
      • Important influence on the shape of the pyramid
      • Represented by the width or base of the pyramid
      • More children = broader base
    • Death rate: slope of the pyramid 
    • Life expectancy: height of the pyramid
  • Short-term trends and significant events:
    • Kinks or indents in the pyramid: indicate decline in birth rates or increase in death rates (e.g., wars, famine, disease)
    • Bulges in the pyramid: indicate increase in birth rates (e.g., baby booms)
  • Information about sex Sex The totality of characteristics of reproductive structure, functions, phenotype, and genotype, differentiating the male from the female organism. Gender Dysphoria ratio of a population and effects of migration
  • Data on future growth of the population:
    • Median age of the population: lower median age, higher population growth

Future needs

  • Forecasts social and economic needs for national planning based on the distribution of the population’s age groups:
    • Working-age population (15–64 years) 
    • Dependents:
      • Children and young adolescents (under 15 years old)
      • Elderly population (65 years and older)
  • Dependency ratio:
    • Ratio between dependents and the working group
    • Higher ratio: more dependents
    • Youth dependency ratio:
      • Ratio between youth < 15 years of age and the working-age group
      • High youth dependency ratio: plan for housing, education, schools
    • Old-age dependency ratio:
      • Ratio between those > 65 years of age and the working-age group
      • High old-age dependency ratio: plan for health care, pension, nursing homes

Types of Population Pyramids

Stationary pyramid

  • Overall shape is a rectangle, tapering at the top.
  • Describes a population with:
    • Low fertility rate
    • Low mortality Mortality All deaths reported in a given population. Measures of Health Status rate
    • High life expectancy
    • Almost equal percentages in the age groups 
  • Indicates slow growth of the population
  • Seen in developed countries
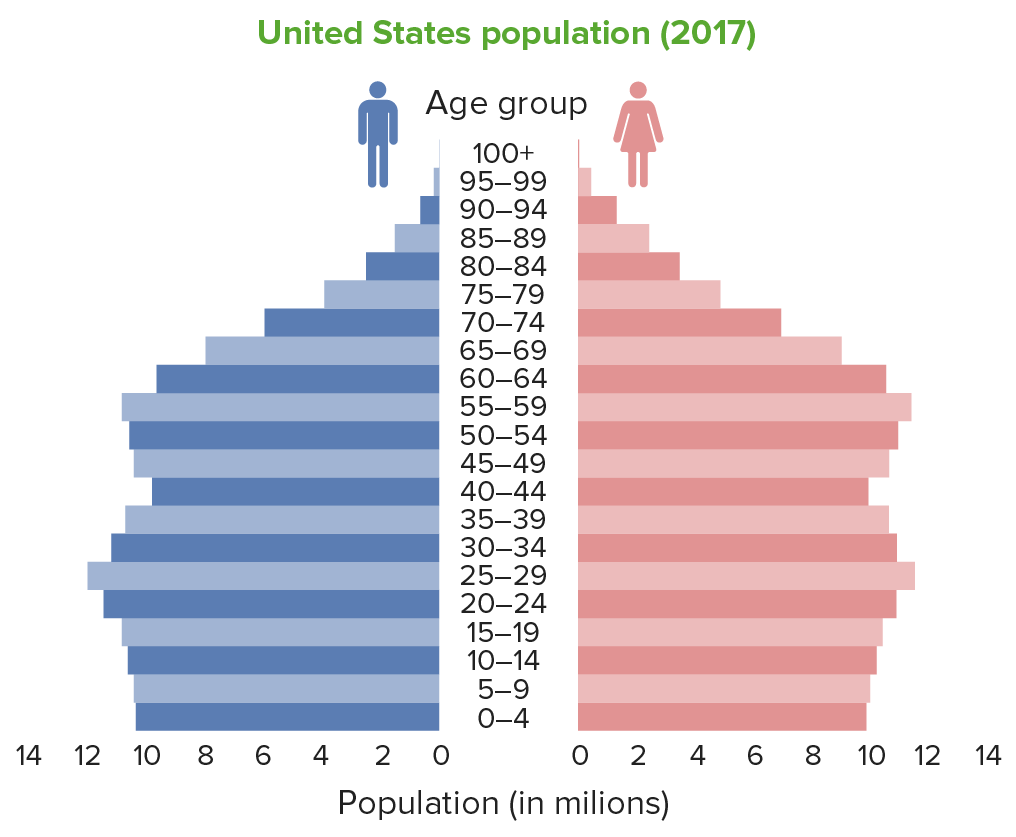
Population pyramid usa

Stationary population pyramid (United States) in 2017, showing even bars indicating that most age groups are almost equal in size

Image by Lecturio.
Expansive pyramid

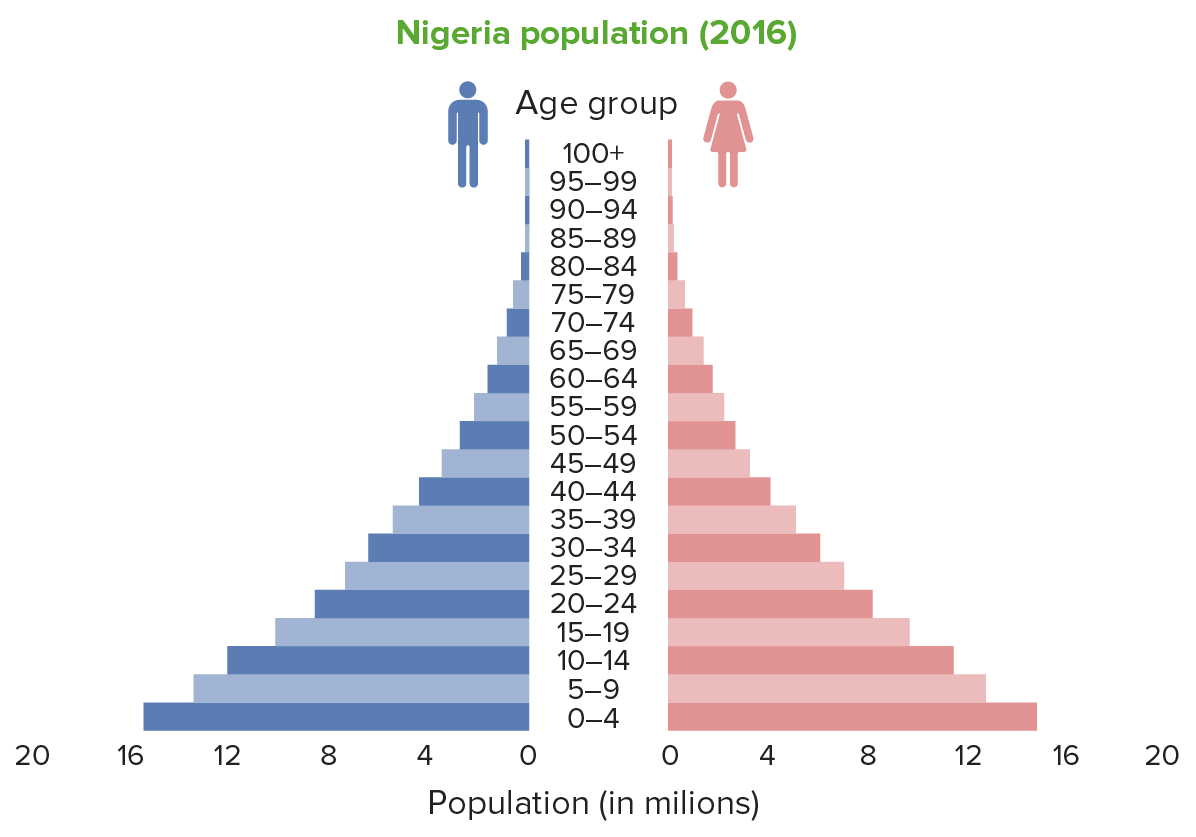
  • Overall shape is an upright pyramid, with a broad base. 
  • Describes a population with:
  • Each age group is smaller than the age group before it.
  • Indicates fast growth of the population, with small share of older people
  • Seen in developing countries
Population pyramid nigeria

Expansive population pyramid (Nigeria): Note the wide base, which is indicative of a high fertility rate.

Image by Lecturio.

Constrictive pyramid

  • Overall shape is an inverted pyramid, with a narrow base. 
  • Describes a population with:
  • Narrowing at the bottom of the graph indicates that the population is shrinking.
  • Large share of the population is aging.
  • Seen in wealthy, industrialized, developed countries (high literacy, good access to birth control and healthcare)
Population pyramid germany

Constrictive population pyramid (Germany), showing a narrow base, indicating a low birth rate

Image by Lecturio.

Stages of Population Pyramids

Demographic transition model

  • Shows the population growth trend as it develops from a pre-industrial to an industrialized economic system
  • Pattern associated with:
    • A drop in mortality Mortality All deaths reported in a given population. Measures of Health Status rates
    • An increase in population growth 
    • A fall in birth rates as the country becomes more developed

Sequence of stages

Stage 1 Stage 1 Trypanosoma brucei/African trypanosomiasis: high stationary

  • Increased birth rate 
  • Increased mortality Mortality All deaths reported in a given population. Measures of Health Status rate, even in younger age groups
  • No population growth

Stage 2: early expanding

  • Triangular shape
  • Increased birth rate
  • Decreasing mortality Mortality All deaths reported in a given population. Measures of Health Status rate 
  • Improving life expectancy
  • Increased rate of population growth affected by:
    • Improved healthcare and sanitation Sanitation The development and establishment of environmental conditions favorable to the health of the public. Hepatitis E Virus
    • Better education

Stage 3: late expanding

  • Dome-shaped pyramid
  • Decreasing birth rate and mortality Mortality All deaths reported in a given population. Measures of Health Status rate
  • Increasing life expectancy
  • Population still increases but growth rate declines. 
  • Affected by:
    • Family planning
    • Women’s empowerment
    • Technological and economic changes
    • Changing norms (desire for material possessions, fewer children)

Stage 4: low stationary

  • Barrel-shaped pyramid
  • Low birth and low mortality Mortality All deaths reported in a given population. Measures of Health Status rates
  • Rapid growth ends.
  • Juvenile population almost equals the older population.
  • Seen in most developed countries

Stage 5:

  • This stage is yet to be seen in many nations.
  • Low birth and mortality Mortality All deaths reported in a given population. Measures of Health Status rates
  • If the fertility rate of < 2 children per woman persists → population size will decrease.
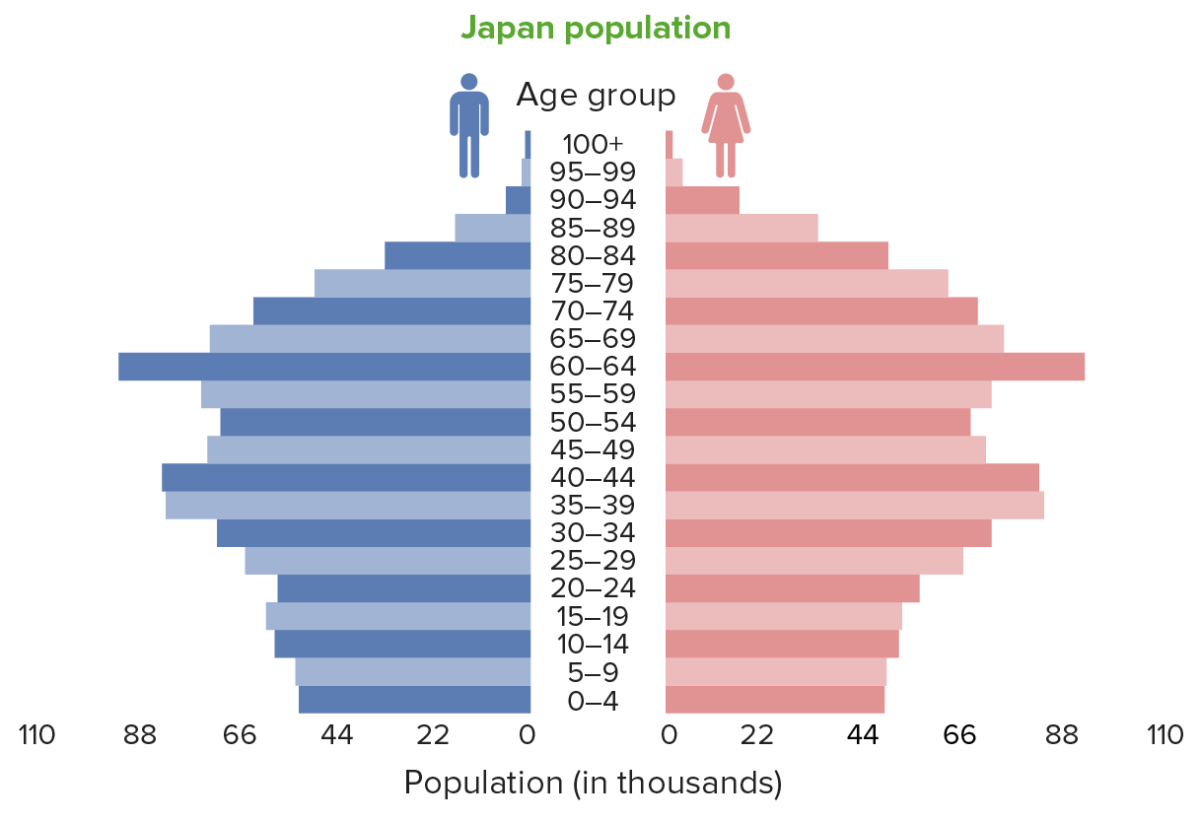
  • Noted in some countries (e.g., Japan, Germany):
    • Contracting population
    • Death rate has already exceeded the birth rate.
    • Older population: increasing more than the juvenile population
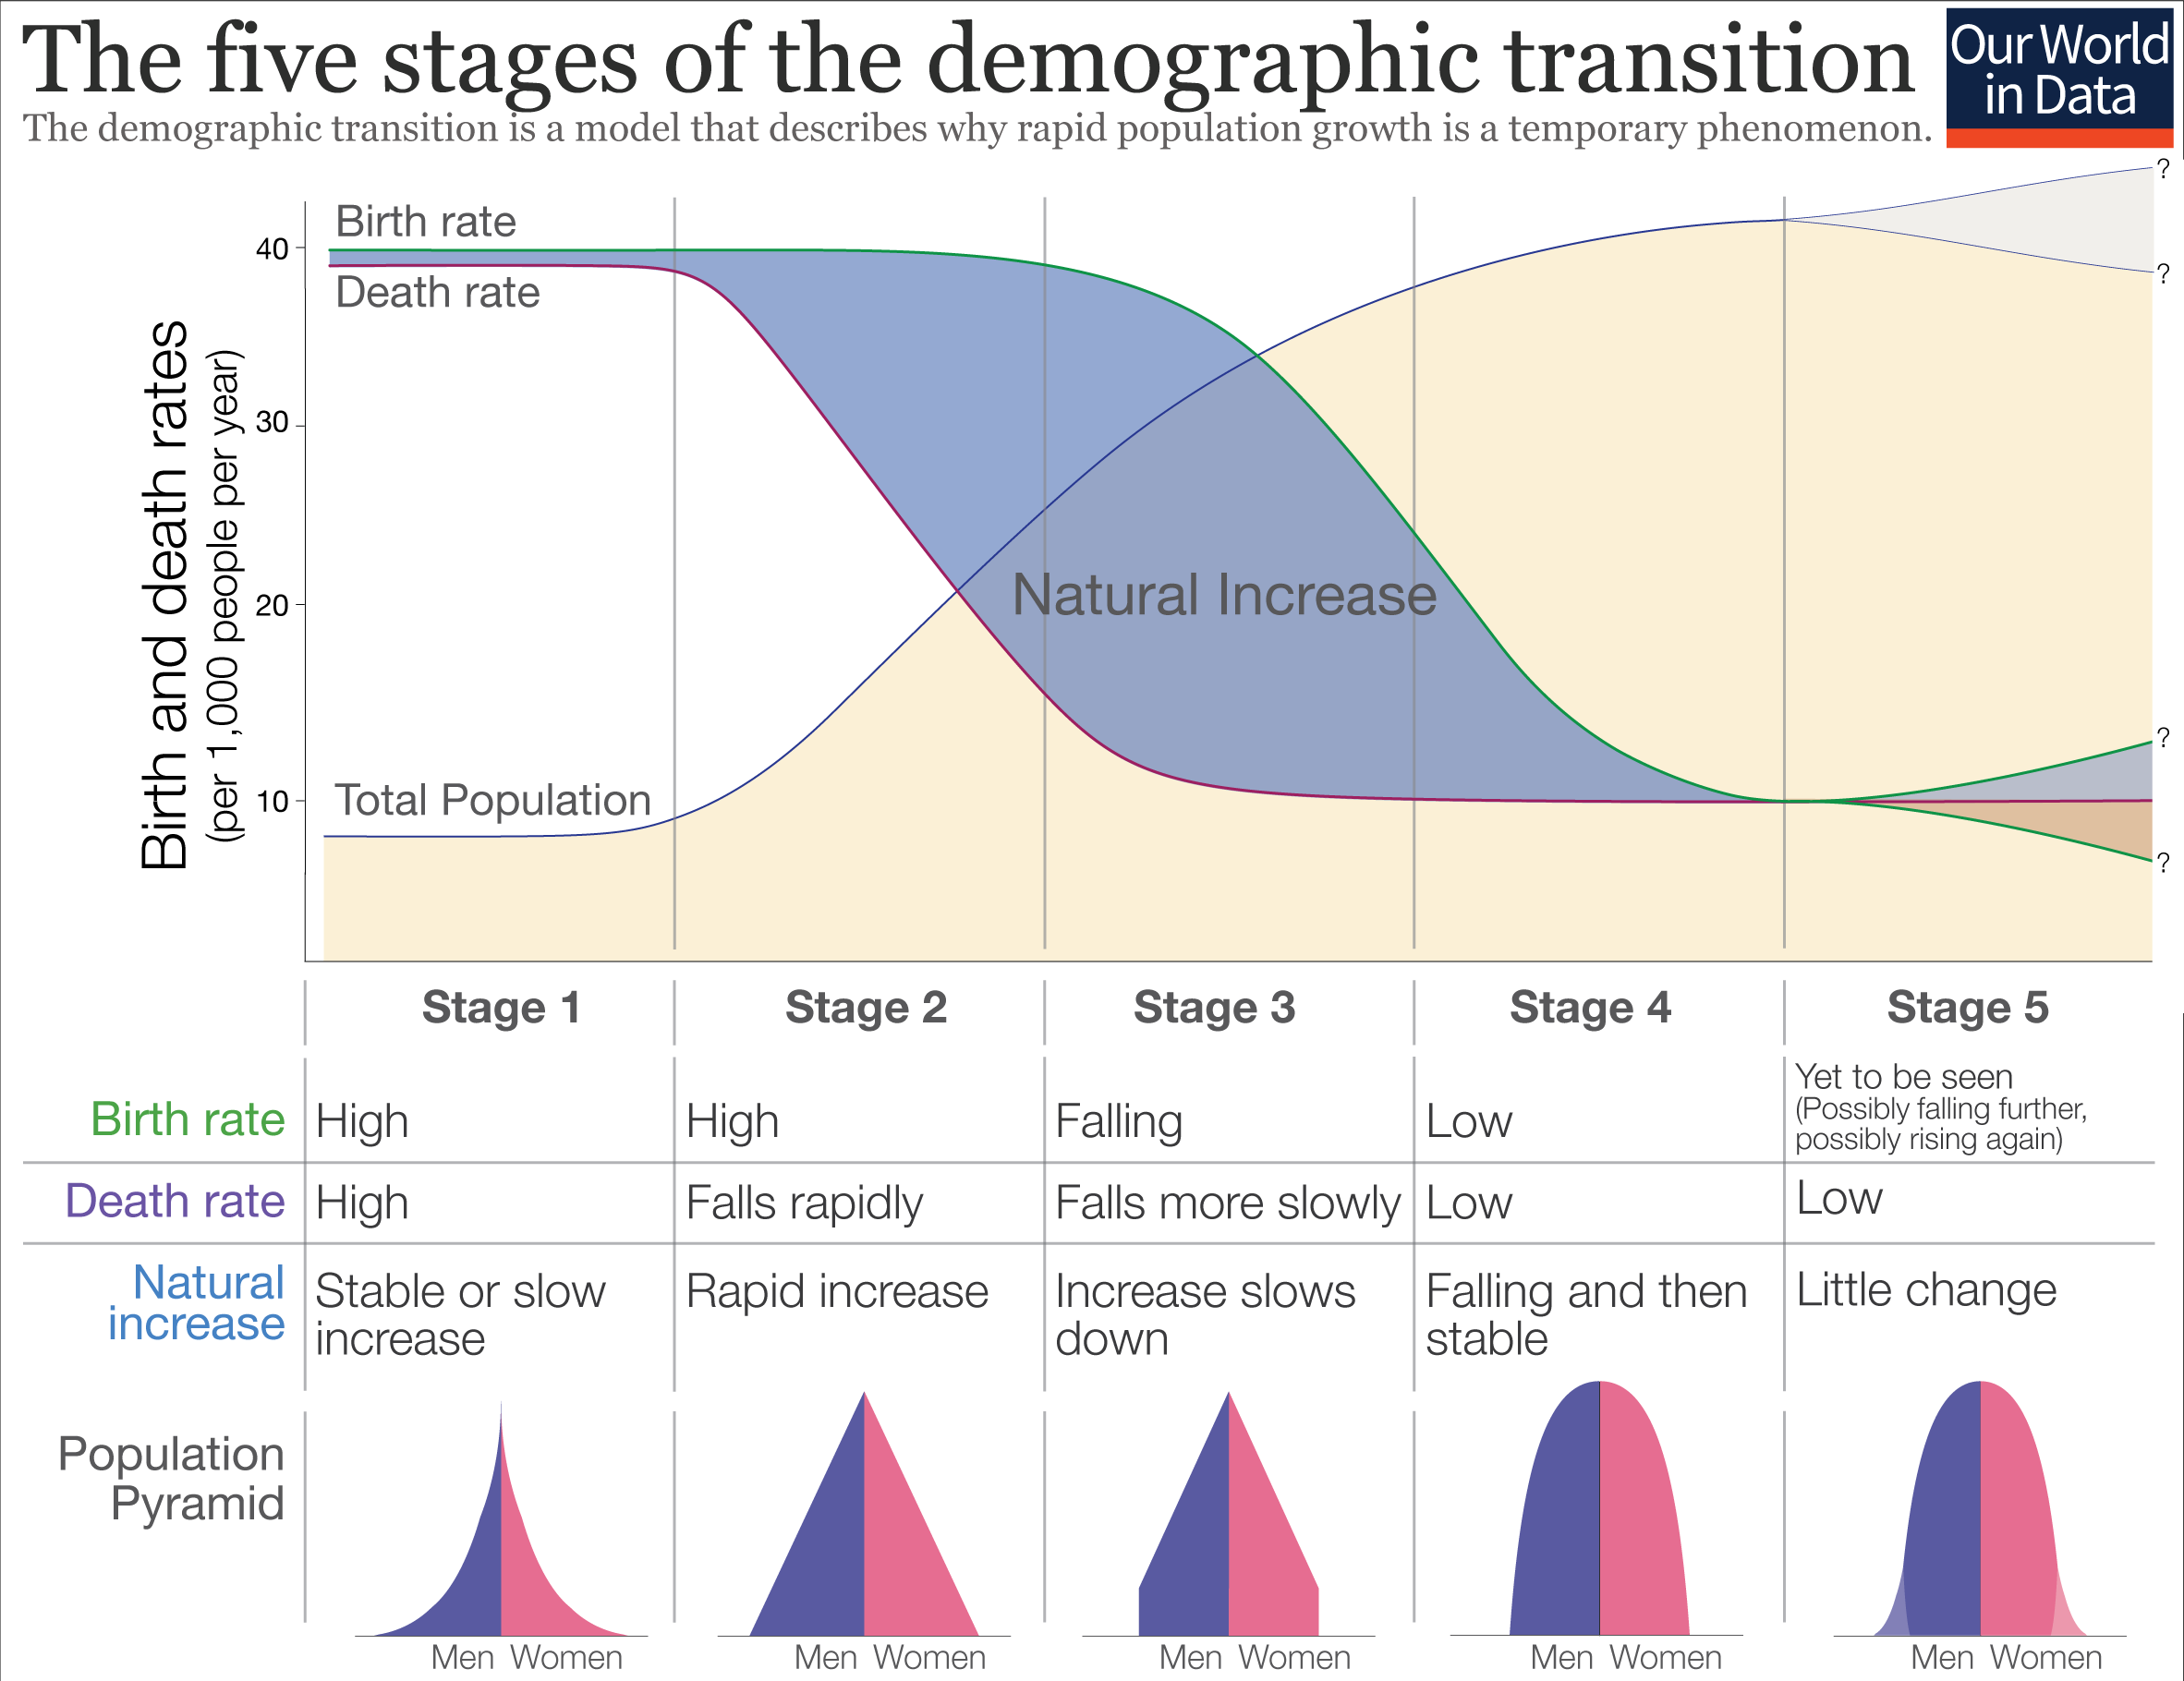
Demographdemographic transition schematicic-transition-schematic

Image illustrating stages of demographic transition, with the upper graph showing an increase in population with a falling death rate. Lower illustration shows the trend of population pyramids. The birth and death rates change through different stages in the model. As the population experiences prosperity and modernization, both birth and mortality rates fall. At stage 4, the population is stable but the growth rate is declining. Stage 5 is noted in a few nations, but is yet to be seen in most countries.

Image: “Five stages of the demographic transition” by Our World in Data. License: CC BY 4.0

References

  1. Principles of Epidemiology in Public Health Practice.cdc.gov. Retrieved 12 Oct 2020, from https://www.cdc.gov/csels/dsepd/ss1978/lesson4/section3.html
  2. Federico, B., Capelli, G., Costa, G., Mackenbach, J., Kunst, A. (2012) Looking at the smoking epidemic through the lens of population pyramids: sociodemographic patterns of smoking in Italy, 1983 to 2005. https://www.ncbi.nlm.nih.gov/pmc/articles/PMC3573981/#!po=1.21951
  3. Jones, M., Bourbeau, C. (2019) What Population Pyramids Reveal About The Past, Present And Future. https://www.wiscontext.org/what-population-pyramids-reveal-about-past-present-and-future
  4. Population reference bureau. Glossary of demographic terms. Retrieved 14 Oct 2020, from https://www.prb.org/glossary/
  5. Ritchie, H., Rosser, M. (2019)  Age structure. Retrieved 12 Oct 2020, from https://ourworldindata.org/age-structure
  6. Rosser, M., Ritchie, H., Ortiz-Ospina, E. (2013) World Population Growth. OurWorldInData.org. Retrieved 13 Oct 2020, from: https://ourworldindata.org/world-population-growth 
  7. Saroha, J. (2018) Types and Significance of Population pyramids. Worldwide Journal of Multidisciplinary Research and Development 4 (4): 59–69.
  8. Bloom, D. E., & Luca, D. L. (2016). The global demography of aging: Facts, explanations, future. In J. Piggott & A. Woodland (Eds.), Handbook of the Economics of Population Aging (Vol. 1, pp. 3-56). Elsevier.
  9. Bongaarts, J. (2009). Human population growth and the demographic transition. Philosophical Transactions of the Royal Society B: Biological Sciences, 364(1532), 2985-2990.
  10. Chesnais, J. C. (2009). Demographic transition patterns and their impact on the age structure. Population and Development Review, 35(2), 297-310.
  11. Gupta, R., & Yamamoto, K. (2024). Shifting paradigms in population pyramids: A global analysis of demographic transitions in the 21st century. Journal of Population Studies, 42(3), 215-234.
  12. Lee, R. (2003). The demographic transition: Three centuries of fundamental change. Journal of Economic Perspectives, 17(4), 167-190.
  13. Lutz, W., Sanderson, W., & Scherbov, S. (2008). The coming acceleration of global population ageing. Nature, 451(7179), 716-719.
  14. Preston, S. H., Heuveline, P., & Guillot, M. (2000). Demography: Measuring and modeling population processes. Blackwell Publishers.
  15. United Nations, Department of Economic and Social Affairs, Population Division. (2019). World Population Prospects 2019: Highlights. United Nations.
  16. Weeks, J. R. (2020). Population: An introduction to concepts and issues (13th ed.). Cengage Learning.

Create your free account or log in to continue reading!

Sign up now and get free access to Lecturio with concept pages, medical videos, and questions for your medical education.

User Reviews

Unwrap New Skills This Holiday 🎄 Save 30% on all plans now!

Details