Advertisement

Advertisement

Advertisement

Advertisement

Electrocardiogram (ECG)

An electrocardiogram (ECG) is a graphic representation of the electrical activity of the heart plotted against time. Electrocardiograms are simple, inexpensive, noninvasive, and readily obtained. Adhesive electrodes are affixed to the skin Skin The skin, also referred to as the integumentary system, is the largest organ of the body. The skin is primarily composed of the epidermis (outer layer) and dermis (deep layer). The epidermis is primarily composed of keratinocytes that undergo rapid turnover, while the dermis contains dense layers of connective tissue. Skin: Structure and Functions surface allowing measurement of cardiac impulses from many angles. The ECG provides 3-dimensional information about the conduction system of the heart, the myocardium Myocardium The muscle tissue of the heart. It is composed of striated, involuntary muscle cells connected to form the contractile pump to generate blood flow. Heart: Anatomy, and other cardiac structures. In the healthy state, an ECG records predictable, reproducible waves and complexes, which correspond to electromechanically coupled physiologic events in the heart. Under pathologic conditions, the ECG can detect arrhythmias, ischemia Ischemia A hypoperfusion of the blood through an organ or tissue caused by a pathologic constriction or obstruction of its blood vessels, or an absence of blood circulation. Ischemic Cell Damage, inflammation Inflammation Inflammation is a complex set of responses to infection and injury involving leukocytes as the principal cellular mediators in the body's defense against pathogenic organisms. Inflammation is also seen as a response to tissue injury in the process of wound healing. The 5 cardinal signs of inflammation are pain, heat, redness, swelling, and loss of function. Inflammation, and more.

Last updated: May 16, 2024

Editorial responsibility: Stanley Oiseth, Lindsay Jones, Evelin Maza

Advertisement

Advertisement

Advertisement

Advertisement

Advertisement

Advertisement

Advertisement

Advertisement

Overview

In 1902 the electrocardiogram (ECG) was invented by Willem Einthoven, a Dutch physician. Einthoven received the 1924 Nobel Prize in Physiology or Medicine for the invention.

Terminology

Electrocardiogram is abbreviated/referred to as: 
  • ECG: American spelling 
  • EKG: European spelling
  • The terms may be used interchangeably.
  • Clinically referred to as a 12-lead ECG

ECG electrodes and leads

  • Conductive electrodes are affixed to the skin Skin The skin, also referred to as the integumentary system, is the largest organ of the body. The skin is primarily composed of the epidermis (outer layer) and dermis (deep layer). The epidermis is primarily composed of keratinocytes that undergo rapid turnover, while the dermis contains dense layers of connective tissue. Skin: Structure and Functions with adhesive backing.
  • 10 electrodes are required to produce a 12-lead ECG:
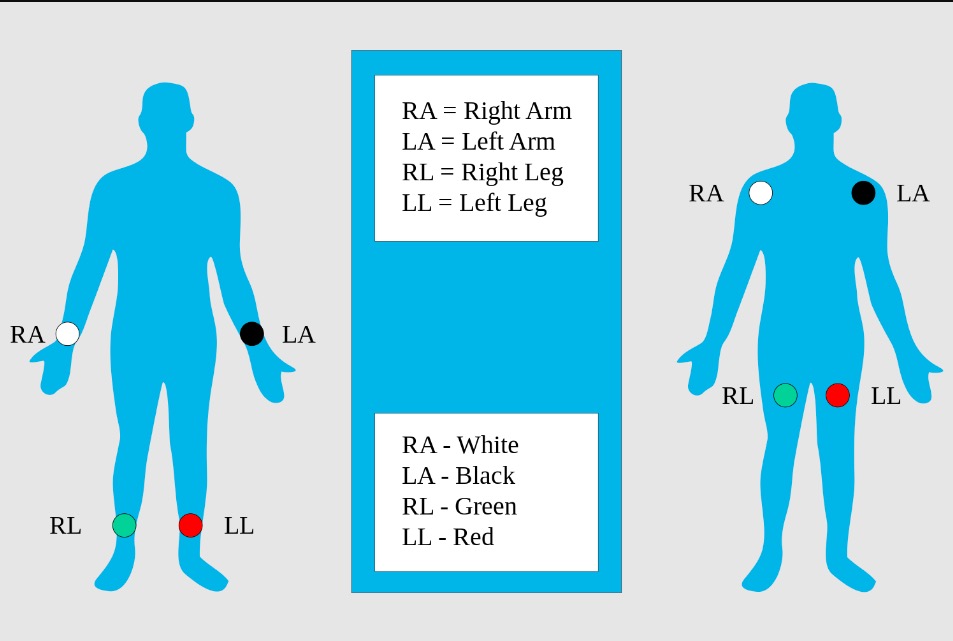
    • 1 electrode is affixed to each limb:
      • Historically, a resting ECG was affixed to the distal limb.
      • In the clinical setting, a resting ECG is affixed to the thorax near the corresponding limb.
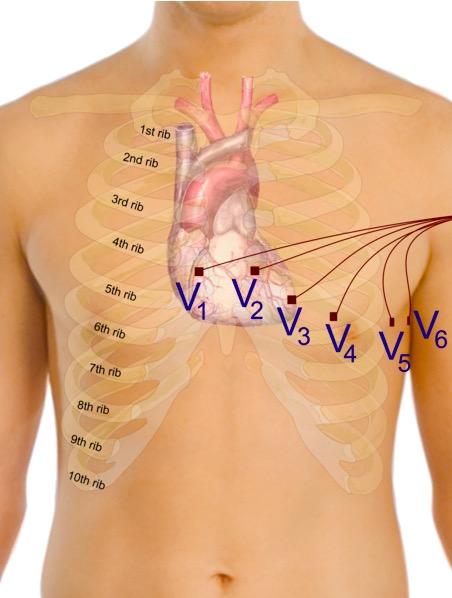
    • 6 electrodes are placed on the precordium:
      • V1: 4th intercostal space (ICS), RIGHT margin of the sternum Sternum A long, narrow, and flat bone commonly known as breastbone occurring in the midsection of the anterior thoracic segment or chest region, which stabilizes the rib cage and serves as the point of origin for several muscles that move the arms, head, and neck. Chest Wall: Anatomy
      • V2: 4th ICS, LEFT margin of the sternum Sternum A long, narrow, and flat bone commonly known as breastbone occurring in the midsection of the anterior thoracic segment or chest region, which stabilizes the rib cage and serves as the point of origin for several muscles that move the arms, head, and neck. Chest Wall: Anatomy
      • V4: 5th ICS, midclavicular line
      • V3: midway between V2 and V4
      • V5: 5th ICS, anterior axillary line 
      • V6: 5th ICS, midaxillary line Midaxillary Line Examination of the Breast 
  • 12 lead is created by ECG machine/software voltages transmitted from electrodes:
    • 3 bipolar Bipolar Nervous System: Histology limb leads (recording obtained from pairs of limb electrodes):
      • I: right arm Arm The arm, or “upper arm” in common usage, is the region of the upper limb that extends from the shoulder to the elbow joint and connects inferiorly to the forearm through the cubital fossa. It is divided into 2 fascial compartments (anterior and posterior). Arm: Anatomy (-) and left arm Arm The arm, or “upper arm” in common usage, is the region of the upper limb that extends from the shoulder to the elbow joint and connects inferiorly to the forearm through the cubital fossa. It is divided into 2 fascial compartments (anterior and posterior). Arm: Anatomy (+) electrodes
      • II: right arm Arm The arm, or “upper arm” in common usage, is the region of the upper limb that extends from the shoulder to the elbow joint and connects inferiorly to the forearm through the cubital fossa. It is divided into 2 fascial compartments (anterior and posterior). Arm: Anatomy (-) and left leg Leg The lower leg, or just “leg” in anatomical terms, is the part of the lower limb between the knee and the ankle joint. The bony structure is composed of the tibia and fibula bones, and the muscles of the leg are grouped into the anterior, lateral, and posterior compartments by extensions of fascia. Leg: Anatomy (+) electrodes
      • III: left arm Arm The arm, or “upper arm” in common usage, is the region of the upper limb that extends from the shoulder to the elbow joint and connects inferiorly to the forearm through the cubital fossa. It is divided into 2 fascial compartments (anterior and posterior). Arm: Anatomy (-) and left leg Leg The lower leg, or just “leg” in anatomical terms, is the part of the lower limb between the knee and the ankle joint. The bony structure is composed of the tibia and fibula bones, and the muscles of the leg are grouped into the anterior, lateral, and posterior compartments by extensions of fascia. Leg: Anatomy (+) electrodes
      • Einthoven triangle: A schematic triangle made from the 3 electrodes involved in creating leads I, II, and III.
    • 3 augmented unipolar Unipolar Nervous System: Histology limb leads (recording obtained from a limb electrode and the central terminal):
      • Augmented Vector Right ( aVR AVR Aortic Stenosis): right arm Arm The arm, or “upper arm” in common usage, is the region of the upper limb that extends from the shoulder to the elbow joint and connects inferiorly to the forearm through the cubital fossa. It is divided into 2 fascial compartments (anterior and posterior). Arm: Anatomy (+) electrode and the central terminal (-)
      • Augmented Vector Left (aVL): left-arm (+) electrode and the central terminal (-)
      • Augmented Vector Foot Foot The foot is the terminal portion of the lower limb, whose primary function is to bear weight and facilitate locomotion. The foot comprises 26 bones, including the tarsal bones, metatarsal bones, and phalanges. The bones of the foot form longitudinal and transverse arches and are supported by various muscles, ligaments, and tendons. Foot: Anatomy (aVF): left leg Leg The lower leg, or just “leg” in anatomical terms, is the part of the lower limb between the knee and the ankle joint. The bony structure is composed of the tibia and fibula bones, and the muscles of the leg are grouped into the anterior, lateral, and posterior compartments by extensions of fascia. Leg: Anatomy electrode (+) and the central terminal (-)
    • 6 precordial leads (recording obtained from the corresponding chest electrode and the central terminal):
      • V1, V2: septal leads
      • V3, V4: anterior leads
      • V5, V6: lateral leads

ECG tracing

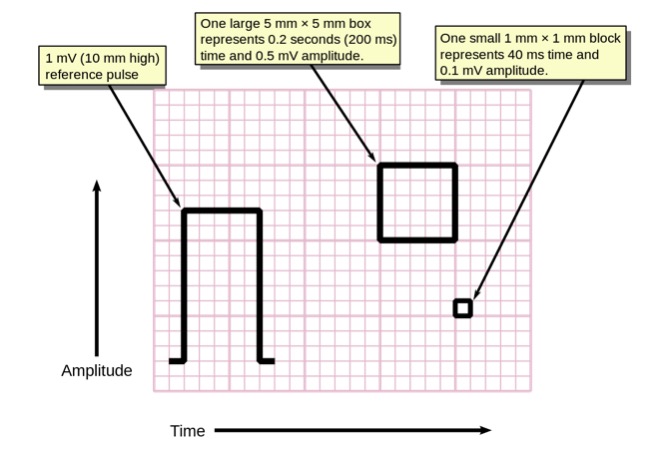
  • Organized as a graph in boxes:
    • Small box = 1 x 1 mm MM Multiple myeloma (MM) is a malignant condition of plasma cells (activated B lymphocytes) primarily seen in the elderly. Monoclonal proliferation of plasma cells results in cytokine-driven osteoclastic activity and excessive secretion of IgG antibodies. Multiple Myeloma
    • Large box = 5 x 5 mm MM Multiple myeloma (MM) is a malignant condition of plasma cells (activated B lymphocytes) primarily seen in the elderly. Monoclonal proliferation of plasma cells results in cytokine-driven osteoclastic activity and excessive secretion of IgG antibodies. Multiple Myeloma (5 small boxes)
  • X and Y axes:
    • X axis = time in seconds
    • Y axis = voltage in mV
  • X-axis utility:
    • ECG tracing speed = 25 mm MM Multiple myeloma (MM) is a malignant condition of plasma cells (activated B lymphocytes) primarily seen in the elderly. Monoclonal proliferation of plasma cells results in cytokine-driven osteoclastic activity and excessive secretion of IgG antibodies. Multiple Myeloma/second (25 small boxes/second or 5 large boxes/second) 
    • 1 small box = 0.04 second
    • 1 large box = 0.2 second
    • Allows for heart rate Heart rate The number of times the heart ventricles contract per unit of time, usually per minute. Cardiac Physiology calculation and rhythm determination:
      • Bradycardia Bradycardia Bradyarrhythmia is a rhythm in which the heart rate is less than 60/min. Bradyarrhythmia can be physiologic, without symptoms or hemodynamic change. Pathologic bradyarrhythmia results in reduced cardiac output and hemodynamic instability causing syncope, dizziness, or dyspnea. Bradyarrhythmias vs. tachycardia Tachycardia Abnormally rapid heartbeat, usually with a heart rate above 100 beats per minute for adults. Tachycardia accompanied by disturbance in the cardiac depolarization (cardiac arrhythmia) is called tachyarrhythmia. Sepsis in Children
      • Regular Regular Insulin vs. irregular
    • Allows for measurement of clinically relevant intervals and durations
  • Y-axis utility:
    • 1 small box = 0.1 mV
    • Allows for determination of voltage amplitude of ECG waveforms
    • Amplitude correlates with electromechanically coupled events in the cardiac cycle Cardiac cycle The cardiac cycle describes a complete contraction and relaxation of all 4 chambers of the heart during a standard heartbeat. The cardiac cycle includes 7 phases, which together describe the cycle of ventricular filling, isovolumetric contraction, ventricular ejection, and isovolumetric relaxation. Cardiac Cycle:
      • No deflection = no cardiac conduction or contraction (e.g., isoelectric baseline)
      • Small deflection = low voltage associated with thin myocardium Myocardium The muscle tissue of the heart. It is composed of striated, involuntary muscle cells connected to form the contractile pump to generate blood flow. Heart: Anatomy (atria) and modest contraction (e.g., P wave)
      • Large deflection = high voltage associated with thick myocardium Myocardium The muscle tissue of the heart. It is composed of striated, involuntary muscle cells connected to form the contractile pump to generate blood flow. Heart: Anatomy (ventricle) and forceful contraction (e.g., QRS complex)
Measuring time and voltage with ecg graph paper

ECG voltage pulse and size of squares

Image: “Measuring time and voltage with ECG graph paper” by Markus Kuhn. License: Public Domain

Components

A normal ECG tracing will have several predictable and reproducible components corresponding to electromechanical events in the cardiac cycle Cardiac cycle The cardiac cycle describes a complete contraction and relaxation of all 4 chambers of the heart during a standard heartbeat. The cardiac cycle includes 7 phases, which together describe the cycle of ventricular filling, isovolumetric contraction, ventricular ejection, and isovolumetric relaxation. Cardiac Cycle

Electrical impulse of heart contraction

  • Isoelectric baseline:
    • Flat tracing free of positive or negative deflections in between waves and/or complexes
    • Represents periods of electrical inactivity in the cardiac cycle Cardiac cycle The cardiac cycle describes a complete contraction and relaxation of all 4 chambers of the heart during a standard heartbeat. The cardiac cycle includes 7 phases, which together describe the cycle of ventricular filling, isovolumetric contraction, ventricular ejection, and isovolumetric relaxation. Cardiac Cycle
  • Waves:
  • Intervals:
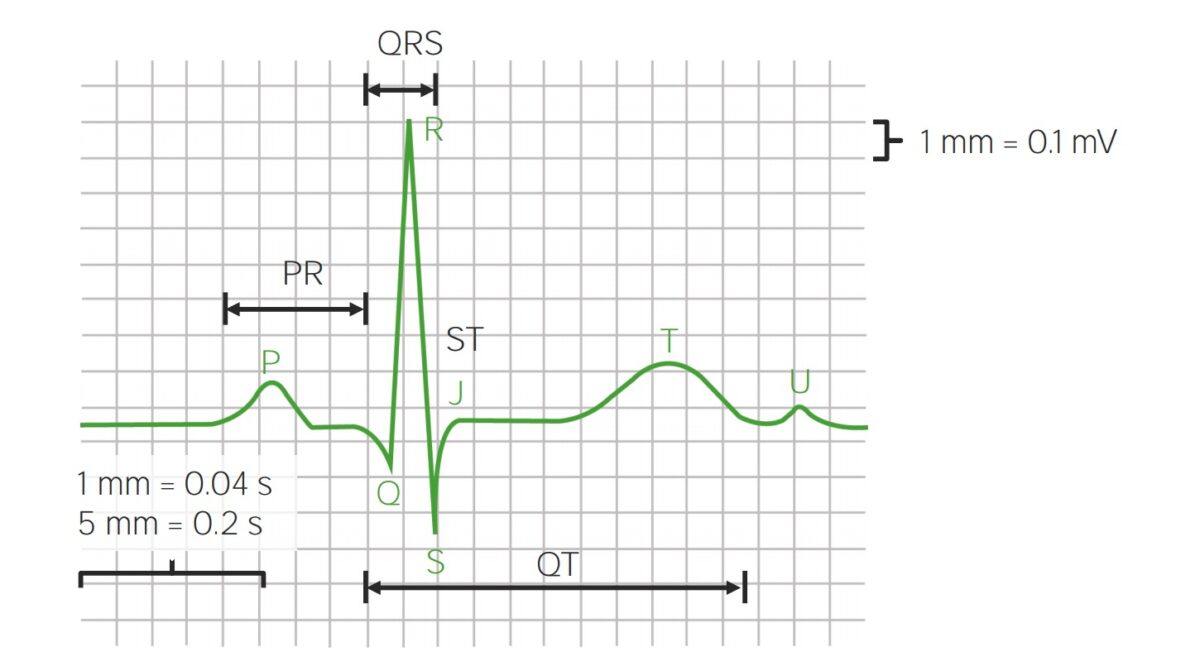
    • PR interval:
      • From the beginning of the P wave to the initial defection of the QRS complex
      • Represents the time needed for the electrical impulse to travel from the sinoatrial (SA) node to the atrioventricular (AV) node
    • QT interval:
    • RR RR Relative risk (RR) is the risk of a disease or condition occurring in a group or population with a particular exposure relative to a control (unexposed) group. Measures of Risk interval:
      • The time between 2, successive QRS complexes
      • Used to calculate heart rate Heart rate The number of times the heart ventricles contract per unit of time, usually per minute. Cardiac Physiology
  • Segments:
    • PQ segment: isoelectric segment between the P wave and initial deflection of the QRS complex
    • ST segment: isoelectric segment between the S wave and the initial deflection of the T wave
    • TP segment: isoelectric baseline between the T wave and the initial deflection of the P wave
  • QRS complex: 
    • Represents ventricular depolarization Depolarization Membrane Potential
    • Composed of 3 waves:
      • Q wave: negative deflection
      • R wave: positive deflection
      • S wave: negative deflection
  • Depending on the ECG lead monitored:
    • QS wave: Positive deflection may not be apparent (i.e. no R wave).
    • RS wave: Negative deflection may not be apparent (i.e. no Q wave).
    • QRS complex: Collective ventricular depolarization Depolarization Membrane Potential regardless of the presence or absence of all components.
Parts of ecg waveforms and intervals

Parts of ECG waveforms and intervals

Image by Lecturio. License: CC BY-NC-SA 4.0
Correlation Correlation Determination of whether or not two variables are correlated. This means to study whether an increase or decrease in one variable corresponds to an increase or decrease in the other variable. Causality, Validity, and Reliability to electromechanical coupling

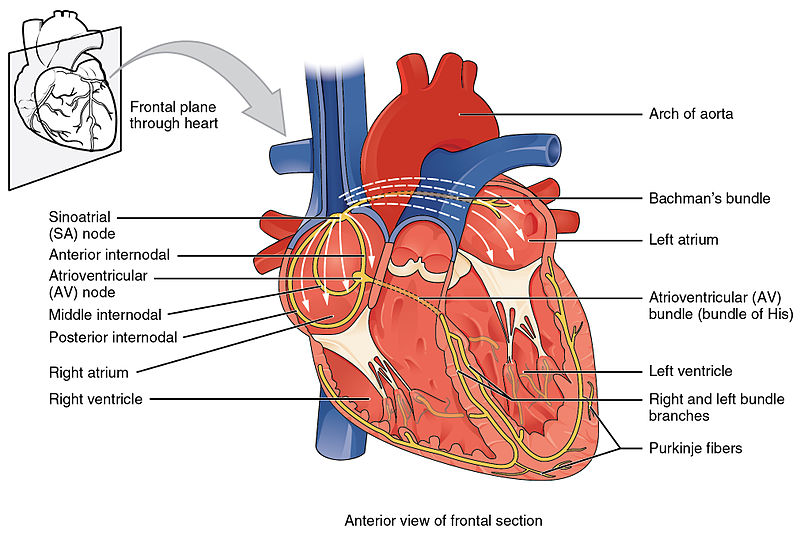
  • The cardiac electrical cycle begins spontaneously in the SA node of the right atrium:
    • ECG: termination of TP segment, onset of the P wave 
    • Mechanical: atria infused with blood from passive venous filling:
      • Vena cava: fills the right atrium
      • Pulmonary veins Pulmonary veins The veins that return the oxygenated blood from the lungs to the left atrium of the heart. Lungs: Anatomy: fill the left atrium
  • Electrical impulse of depolarization Depolarization Membrane Potential spreads throughout the atria via the internodal pathways and arrives at the AV node located in the AV septum:
    • ECG: completion of the P wave:
      • The atria repolarize electrically during the ventricular portions of the cardiac electrical cycle.
      • Atrial repolarization Repolarization Membrane Potential is obscured by the QRS complex on ECG tracing.
    • Mechanical: atrial contraction, ventricular relaxation:
      • Tricuspid/mitral valves open
      • Pulmonic/aortic valves close
      • Ventricles fill with blood
  • Electrical activity is slowed considerably by specialized conductive cells in the central portions of the AV node:
    • ECG: PQ segment (isoelectric baseline)
    • Mechanical: ventricles fill with blood from atrial contraction, atria relax and passively fill with blood
  • Electrical activity resumes as the cardiac impulse arrives at the rapidly conducting pathways in the interventricular septum Interventricular Septum Ventricular Septal Defect (VSD) (atrioventricular bundle or His bundle):
    • ECG: onset of Q wave
    • Mechanical: ventricular septum contracts, passive atrial filling continues:
      • Tricuspid/mitral valves shut, chordae tendineae Chordae tendineae The tendinous cords that connect each cusp of the two atrioventricular heart valves to appropriate papillary muscles in the heart ventricles, preventing the valves from reversing themselves when the ventricles contract. Heart: Anatomy taut
      • Papillary muscles Papillary muscles Conical muscular projections from the walls of the cardiac ventricles, attached to the cusps of the atrioventricular valves by the chordae tendineae. Heart: Anatomy isometrically contract to maintain the integrity of tricuspid/mitral apparatus
  • Electrical activity spreads toward the apex of the heart along the right and left bundle branches traversing the thickest portions of the myocardium Myocardium The muscle tissue of the heart. It is composed of striated, involuntary muscle cells connected to form the contractile pump to generate blood flow. Heart: Anatomy:
    • ECG: R wave
    • Mechanical: continuation of ventricular free wall contraction, passive atrial filling:
      • Tricuspid/mitral valves “balloon” back into the atria
      • Pulmonic/aortic valves open
  • Electrical activity terminates in the Purkinje fibers Purkinje fibers Modified cardiac muscle fibers composing the terminal portion of the heart conduction system. Heart: Anatomy, penetrating the deepest portions of the myocardium Myocardium The muscle tissue of the heart. It is composed of striated, involuntary muscle cells connected to form the contractile pump to generate blood flow. Heart: Anatomy near the endocardium Endocardium The innermost layer of the heart, comprised of endothelial cells. Heart: Anatomy:
    • ECG: S wave
    • Mechanical: completion of ventricular contraction, the continuation of passive atrial filling 
  • Cardiac electrical activity plateaus briefly:
    • ECG: ST segment
    • Mechanical: ventricles begin to relax, passive atrial filling continues:
      • Tricuspid/mitral valves closed
      • Pulmonic/aortic valves closed
  • Ventricular repolarization Ventricular repolarization Cardiac Cycle:
  • Another cardiac cycle Cardiac cycle The cardiac cycle describes a complete contraction and relaxation of all 4 chambers of the heart during a standard heartbeat. The cardiac cycle includes 7 phases, which together describe the cycle of ventricular filling, isovolumetric contraction, ventricular ejection, and isovolumetric relaxation. Cardiac Cycle begins.

Systematic Interpretation

  1. Calibration (voltage and speed): standard:
    • Paper/tracing speed = 25 mm MM Multiple myeloma (MM) is a malignant condition of plasma cells (activated B lymphocytes) primarily seen in the elderly. Monoclonal proliferation of plasma cells results in cytokine-driven osteoclastic activity and excessive secretion of IgG antibodies. Multiple Myeloma/second
    • 1 mm MM Multiple myeloma (MM) is a malignant condition of plasma cells (activated B lymphocytes) primarily seen in the elderly. Monoclonal proliferation of plasma cells results in cytokine-driven osteoclastic activity and excessive secretion of IgG antibodies. Multiple Myeloma (horizontal) = 0.04 second
    • 1 mm MM Multiple myeloma (MM) is a malignant condition of plasma cells (activated B lymphocytes) primarily seen in the elderly. Monoclonal proliferation of plasma cells results in cytokine-driven osteoclastic activity and excessive secretion of IgG antibodies. Multiple Myeloma (vertical) = 0.1 mV
  2. Calculate heart rate Heart rate The number of times the heart ventricles contract per unit of time, usually per minute. Cardiac Physiology:
    • Calculation: divide 300 by the number of large squares between RR RR Relative risk (RR) is the risk of a disease or condition occurring in a group or population with a particular exposure relative to a control (unexposed) group. Measures of Risk intervals
    • Normal heart rate Heart rate The number of times the heart ventricles contract per unit of time, usually per minute. Cardiac Physiology: 60–100/min
  3. Determine rhythm: normal sinus rhythm Sinus rhythm A heart rate and rhythm driven by the regular firing of the SA node (60–100 beats per minute) Cardiac Physiology criteria:
    • Normal P-wave morphology
    • A regular Regular Insulin QRS complex follows every P wave
    • Normal, constant PR/ RR RR Relative risk (RR) is the risk of a disease or condition occurring in a group or population with a particular exposure relative to a control (unexposed) group. Measures of Risk intervals
  4. Determine timing intervals (PR, QRS, QTC):
    • Manual calculation by measuring horizontal blocks
    • Electronic calculation by machine/software (usually listed in the top-left corner)
    • PR interval 0.12–0.2 second
    • QRS complex < 0.12 second
    • QTC interval 0.30–0.46 second
  5. Determine mean QRS axis:
    • Direction of QRS deflection:
      • Positive: The mean electrical vector travels towards the positive electrode in a given lead.
      • Negative: The mean electrical vector travels away from the positive electrode in a given lead.
    • Normal: -30°–100°
    • Normally positive in lead II and lead aVF
  6. Evaluate P-wave morphology by voltage size and deflection:
    • Normal time < 0.12 second
    • Normally upright in lead II and lead aVF
  7. Evaluate QRS morphology and/or voltage:
    • Normal duration < 0.12 second
    • R wave should transition in amplitude in the precordial leads:
      • Lowest voltage in V1
      • Highest voltage in V6
  8. Evaluate ST-segment and T-wave morphology:
    • ST segment:
      • Flat, isoelectric segment after QRS complex, but before T wave
      • Normally no depression or elevation
    • T wave: normally concordant with QRS complex
  9. Compare with prior tracings if available.
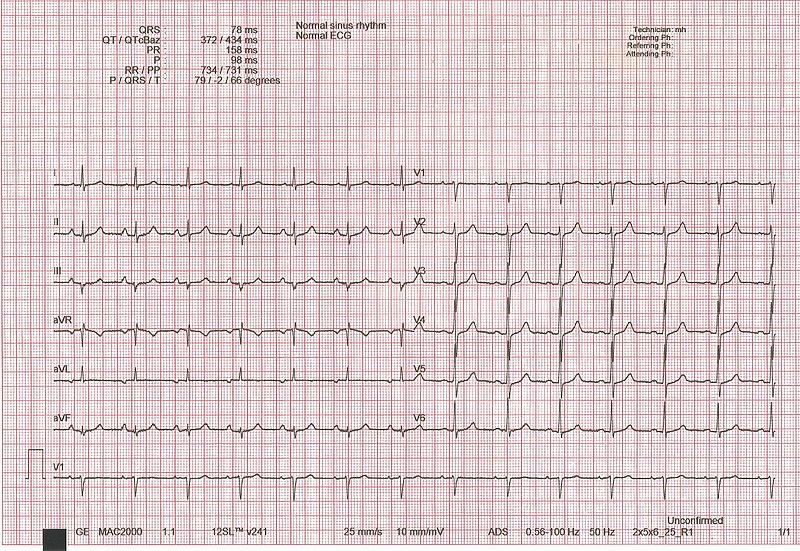
Ecg interpretation

Normal ECG: 12-lead tracing with a V1 rhythm strip displayed at the bottom

Image: “ECG interpretation” by Rodhullandemu. License: Public Domain

References

  1. Sattar Y, Chhabra L. Electrocardiogram. [Updated 2020 Nov 26]. In: StatPearls [Internet]. Treasure Island (FL): StatPearls Publishing; 2021 Jan-. https://www.ncbi.nlm.nih.gov/books/NBK549803/
  2. Prutkin, J. (2019). ECG tutorial: Basic principles of ECG analysis. Retrieved June 6, 2021, from https://www.uptodate.com/contents/ecg-tutorial-basic-principles-of-ecg-analysis
  3. Prutkin, J. (2019). ECG tutorial: Electrical components of the ECG. Retrieved June 6, 2021, from https://www.uptodate.com/contents/ecg-tutorial-electrical-components-of-the-ecg

User Reviews

Details