Types of Variables

Variables represent information about something that can change. The design of the measurement scales Scales Dry or greasy masses of keratin that represent thickened stratum corneum. Secondary Skin Lesions, or of the methods for obtaining information, will determine the data gathered and the characteristics of that data. As a result, a variable can be qualitative or quantitative, and may be further classified into subgroups. Every possible way to express the value of a variable, or the range of the variable, is called a domain.

Last updated: Aug 8, 2022

Editorial responsibility: Stanley Oiseth, Lindsay Jones, Evelin Maza

Definition

A variable is a placeholder for a value that may be represented in a qualitative or quantitative manner. A function is a relationship Relationship A connection, association, or involvement between 2 or more parties. Clinician–Patient Relationship between multiple variables.

2 major classes of variables:

  • Qualitative: represent categories
    • Nominal
    • Ordinal
  • Quantitative: represent a measurable quantity 
    • Continuous
    • Discrete

Within epidemiology:

In epidemiology, a variable is understood as a set of attributes.
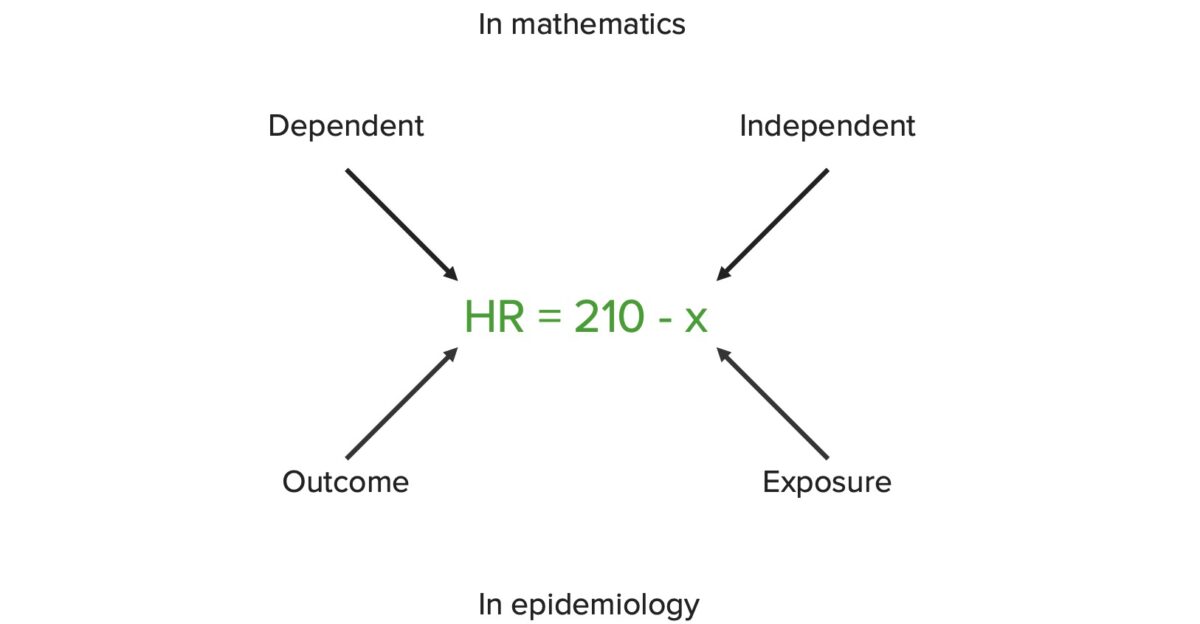
  • Independent variable = exposure, what is manipulated 
  • Dependent variable = outcome, what is measured
Interpretations of variables

The distinct interpretations of the independent and dependent variables in mathematics and epidemiology:
This example illustrates a function commonly utilized to estimate the target exercise heart rate (HR) for a patient based on age. The patient’s age (x) can be changed, and is thus the independent variable (or exposure). HR represents the patient’s target exercise heart rate, and is calculated based on the independent variable. Because of this, HR considered the dependent variable (or outcome).

Image by Lecturio.

Qualitative Variables

Nominal:

  • Refer to the name given to each category, which don’t have a number or rank in a scale Scale Dermatologic Examination
  • E.g., surgical sutures, blood groups, occupations, food groups

Ordinal or ranked:

  • Refer to the degrees of a measuring scale Scale Dermatologic Examination, which can’t be summed or averaged
  • E.g., degrees of burn injury, extent of pitting edema Pitting edema Edema caused by excess fluid without excess colloid. Leaves “pits” due to fluid displacement when pressure is applied to the area Edema in lower limb, intensity of heart murmur

Quantitative Variables

Continuous:

  • There is value in between their values; they are thus infinite.
  • E.g., age, height, blood pressure, serum glucose Glucose A primary source of energy for living organisms. It is naturally occurring and is found in fruits and other parts of plants in its free state. It is used therapeutically in fluid and nutrient replacement. Lactose Intolerance (one can measure a person’s height as 2 m, 2.1 m, 2.2 m, etc ETC The electron transport chain (ETC) sends electrons through a series of proteins, which generate an electrochemical proton gradient that produces energy in the form of adenosine triphosphate (ATP). Electron Transport Chain (ETC).)

Discrete:

  • There is no value between them.
  • E.g., amount of people (it is not possible to have 1.5 people)
  • Categorization:
    • A continuous data series is divided into categories.
    • E.g., religion: People can describe themselves as Christian, Muslim, Jewish, etc ETC The electron transport chain (ETC) sends electrons through a series of proteins, which generate an electrochemical proton gradient that produces energy in the form of adenosine triphosphate (ATP). Electron Transport Chain (ETC)
  • Dichotomous, or binary, variables:
    • A categorical variable with only 2 values is referred to as a dichotomous or binary variable.
    • Example: sick or healthy, alive or deceased, normal or abnormal
Dichotomization

Example of the process of dichotomization:
“Dichotomize” means to convert a nondichotomous variable to a dichotomous one.

Image by Lecturio.

References

  1. Katz DL, Elmore JG, Wild DMG, Lucan SC. (2014). Describing variation in data. In Katz DL, Elmore JG, Wild DMG, Lucan SC (Eds.), Jekel’s Epidemiology, Biostatistics, Preventive medicine, and Public Health, pp. 105–118.
  2. Babbie ER. (2009). The Practice of Social Research. 12th edition. Wadsworth Publishing, pp. 14–18.

Create your free account or log in to continue reading!

Sign up now and get free access to Lecturio with concept pages, medical videos, and questions for your medical education.

User Reviews

Details