Types of Biases

Epidemiological studies epidemiological studies Epidemiological studies are used to establish associations between risk factors and health-related outcomes. These studies can take the form of observational or interventional studies. Epidemiological Studies are designed to evaluate a hypothesized relationship Relationship A connection, association, or involvement between 2 or more parties. Clinician–Patient Relationship between an exposure and an outcome; however, the existence and/or magnitude of these relationships may be erroneously affected by the design and execution of the study itself or by conscious or unconscious Unconscious Those forces and content of the mind which are not ordinarily available to conscious awareness or to immediate recall. Psychotherapy errors perpetrated by the investigators or the subjects. These systematic errors are called biases. If not avoided or accounted for, biases can completely invalidate the results of an otherwise well-thought-out study.

Last updated: Aug 11, 2022

Editorial responsibility: Stanley Oiseth, Lindsay Jones, Evelin Maza

Definition of Bias

Bias is an error Error Refers to any act of commission (doing something wrong) or omission (failing to do something right) that exposes patients to potentially hazardous situations. Disclosure of Information in the design, conduct, or analysis of a study that results in a deviation of the test statistic from its true value. This results in an incorrect estimate of an association between an exposure and the target population such that the test statistic generated deviates from its true value.

  • Biases can’t be eliminated completely but can be reduced/minimized through proper study design.
  • 2 major subtypes of bias:
    • Selection Selection Lymphocyte activation by a specific antigen thus triggering clonal expansion of lymphocytes already capable of mounting an immune response to the antigen. B cells: Types and Functions bias: bias caused by some preference in the way subjects are chosen that makes the study groups different from the target population
    • Information bias: bias that results in a systematic error Error Refers to any act of commission (doing something wrong) or omission (failing to do something right) that exposes patients to potentially hazardous situations. Disclosure of Information in the way data are measured or collected
Possible effects of biases
Masking Hides an existing relationship Relationship A connection, association, or involvement between 2 or more parties. Clinician–Patient Relationship between the independent and a dependent variable Dependent variable Types of Variables
False relationships Creates spurious relationships between the independent and a dependent variable Dependent variable Types of Variables
Overestimation Exaggerates the size of an existing relationship Relationship A connection, association, or involvement between 2 or more parties. Clinician–Patient Relationship between the independent and a dependent variable Dependent variable Types of Variables
Underestimation Diminishes the size of an existing relationship Relationship A connection, association, or involvement between 2 or more parties. Clinician–Patient Relationship between the independent and a dependent variable Dependent variable Types of Variables

Selection Bias

Definition

Selection Selection Lymphocyte activation by a specific antigen thus triggering clonal expansion of lymphocytes already capable of mounting an immune response to the antigen. B cells: Types and Functions bias is the error Error Refers to any act of commission (doing something wrong) or omission (failing to do something right) that exposes patients to potentially hazardous situations. Disclosure of Information introduced when the study population does not represent the target population due to some selection Selection Lymphocyte activation by a specific antigen thus triggering clonal expansion of lymphocytes already capable of mounting an immune response to the antigen. B cells: Types and Functions preference.

  • Results in a nonexistent association between the exposure and outcome
  • A selection Selection Lymphocyte activation by a specific antigen thus triggering clonal expansion of lymphocytes already capable of mounting an immune response to the antigen. B cells: Types and Functions preference can exist: 
    • Between study groups
    • Between the selected and excluded participants for the study

Common examples of selection Selection Lymphocyte activation by a specific antigen thus triggering clonal expansion of lymphocytes already capable of mounting an immune response to the antigen. B cells: Types and Functions bias

  • Healthy worker effect: bias occurs because subjects recruited from a workplace environment tend to be healthier and more active than the general population
  • Loss-to-follow-up bias: occurs due to the data loss from participants who are lost during the course of the study due to loss of interest, adverse effect, clinical improvement, etc ETC The electron transport chain (ETC) sends electrons through a series of proteins, which generate an electrochemical proton gradient that produces energy in the form of adenosine triphosphate (ATP). Electron Transport Chain (ETC)
    • Leads to a reduction of the effective sample size Sample size The number of units (persons, animals, patients, specified circumstances, etc.) in a population to be studied. The sample size should be big enough to have a high likelihood of detecting a true difference between two groups. Statistical Power
    • Bias results if the study groups become unmatched or if the subjects who are lost to follow-up differ in exposure and/or outcome from those who remain in the study.
  • Susceptibility bias: In cases where a first disease First disease Measles (also known as rubeola) is caused by a single-stranded, linear, negative-sense RNA virus of the family Paramyxoviridae. It is highly contagious and spreads by respiratory droplets or direct-contact transmission from an infected person. Typically a disease of childhood, measles classically starts with cough, coryza, and conjunctivitis, followed by a maculopapular rash. Measles Virus predisposes to a second disease, the treatment of subjects with the first disease First disease Measles (also known as rubeola) is caused by a single-stranded, linear, negative-sense RNA virus of the family Paramyxoviridae. It is highly contagious and spreads by respiratory droplets or direct-contact transmission from an infected person. Typically a disease of childhood, measles classically starts with cough, coryza, and conjunctivitis, followed by a maculopapular rash. Measles Virus erroneously appears to predispose to causing the second disease.
  • Survival bias: occurs when data are collected only from subjects who have survived an outcome or have met MET Preoperative Care some other clinical criteria related to it
  • Berkson’s bias: occurs due to subjects being chosen from a specific segment of the population that has a more or less intrinsic risk of having the outcome than the general population
    • Also called Berkson’s fallacy or Berkson’s paradox
    • For example, hospitalized patients Patients Individuals participating in the health care system for the purpose of receiving therapeutic, diagnostic, or preventive procedures. Clinician–Patient Relationship have a greater risk for disease than the general population regardless of exposure; thus, in a study looking at the link between smoking Smoking Willful or deliberate act of inhaling and exhaling smoke from burning substances or agents held by hand. Interstitial Lung Diseases and chronic obstructive pulmonary disease Pulmonary disease Diseases involving the respiratory system. Blastomyces/Blastomycosis, choosing hospitalized subjects for the experimental group will result in a greater association than would be seen in the general public.
    • The higher morbidity Morbidity The proportion of patients with a particular disease during a given year per given unit of population. Measures of Health Status of hospital patients Patients Individuals participating in the health care system for the purpose of receiving therapeutic, diagnostic, or preventive procedures. Clinician–Patient Relationship relative to the general population can create spurious associations between diseases.

Information Bias

Definition

Information bias results from systematic errors in the measurement of some exposure, outcome, or variable Variable Variables represent information about something that can change. The design of the measurement scales, or of the methods for obtaining information, will determine the data gathered and the characteristics of that data. As a result, a variable can be qualitative or quantitative, and may be further classified into subgroups. Types of Variables. The major types of information bias are misclassification bias, recall bias, interviewer bias, response bias, reporting bias, observer bias, ascertainment bias, and confirmation bias.
Examples of information bias

  • Misclassification bias: results from the misclassification of exposure or health outcome for subjects in a study. People who do not have a disease are classified as having it, and vice versa.
    • Common reasons include inaccurate records, different disease definitions, or different diagnostic criteria.
    • Differential: caused by a measurement difference that exists between study groups
    • Non-differential: caused by equally inaccurate or random measurements across all study groups
  • Recall bias: caused by the differential (typically, enhanced) recall of events by case subjects compared with controls
  • Interviewer bias: occurs when the interviewer influences the responses of the participant through the method, content, or style of their questioning
  • Response bias: occurs when subjects report what the researchers want to hear because the subject wants to please the interviewer with their response
  • Reporting bias: refers to the tendency of researchers to only report statistically significant results, motivated by the desire to publish
  • Observer bias: occurs due to the differences that exist between observers in the way an outcome is measured or assessed or the difference in the way a subject acts when they are being observed
    • Bias that results from the Hawthorne effect (see below)
  • Ascertainment bias: occurs when certain subjects are more likely to be included in the final results than others
    • Common sources include a group difference in the screening Screening Preoperative Care method or frequency, investigator knowledge of subject group assignments, or allocation preference for subjects into study groups.
  • Confirmation bias: occurs due to the tendency of investigators to only include data that agree with their pre-existing beliefs and/or support their hypothesis Hypothesis A hypothesis is a preliminary answer to a research question (i.e., a “guess” about what the results will be). There are 2 types of hypotheses: the null hypothesis and the alternative hypothesis. Statistical Tests and Data Representation
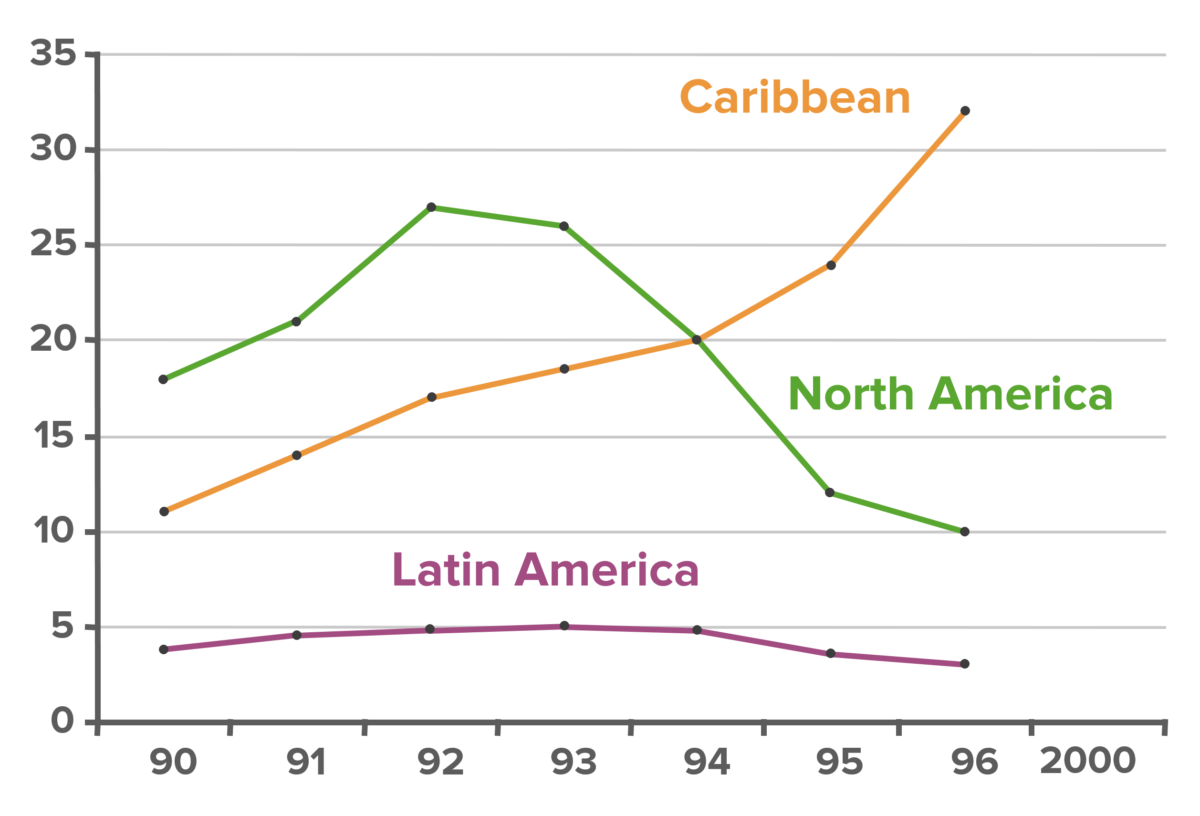
  • Detection bias: occurs due to a difference in the way an outcome is measured or detected based on a particular subject characteristic (see Image 1).
  • Experimenter bias: occurs due to a subject behaving differently based on the investigator’s expectations
    • Bias that results from the Rosenthal effect (see below)
Detection bias

Example of detection bias. Shown above is a graph of the number of new AIDS cases per year per 100,000 population over the time period from 1990–2000. Although the chart seems to suggest that cases of AIDS in the Caribbean are on the rise (orange line), in reality, the steady increase in new cases is due to the increase in screening number and frequency. This is an example of detection bias, a subtype of information bias.

Image by Lecturio.

Hawthorne and Rosenthal Effects

Hawthorne effect

  • Refers to the tendency of subjects in a study to behave or act differently (i.e., work harder) when they know they are being watched
  • Results in and is related to observer bias
  • Especially common in psychiatric studies
  • Bias caused by this effect is difficult to eliminate but can be reduced through hiding from the subjects the knowledge of when/how they are being observed.

Rosenthal effect

  • Refers to the tendency of subjects or investigators to behave differently based on other’s expectations
  • Also called the Pygmalion effect
  • For example, in a study of the efficacy of a new drug to treat depression, subjects in the treatment group report an improvement in depressive symptoms because the investigators who are assessing them expect subjects who are given the treatment to improve.
  • Results in and is related to experimenter bias
  • Bias that results from this effect can be prevented by blinding Blinding Epidemiological Studies.

Confounding Variables

Definition

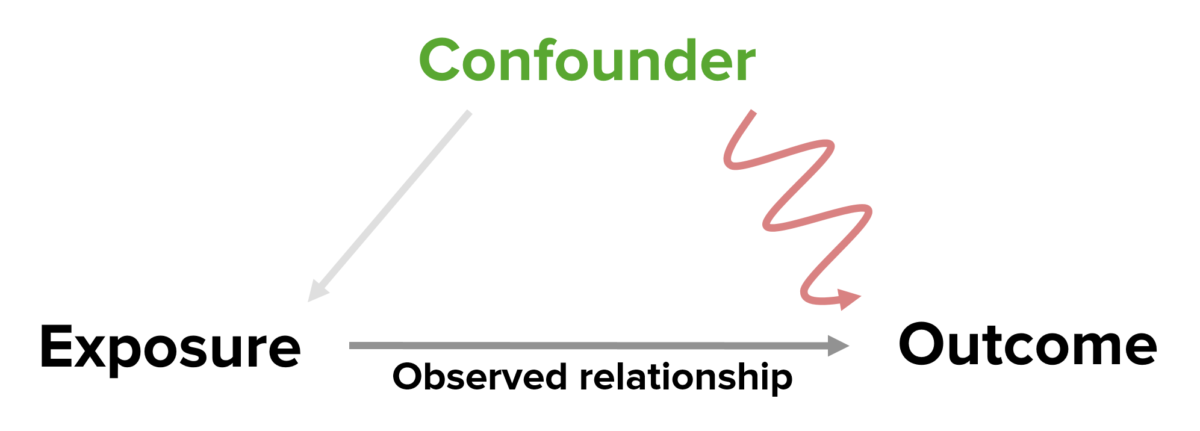
A confound is an additional variable Variable Variables represent information about something that can change. The design of the measurement scales, or of the methods for obtaining information, will determine the data gathered and the characteristics of that data. As a result, a variable can be qualitative or quantitative, and may be further classified into subgroups. Types of Variables other than the independent variable Independent variable Types of Variables that has an effect on the dependent variable Dependent variable Types of Variables, causing an erroneous relationship Relationship A connection, association, or involvement between 2 or more parties. Clinician–Patient Relationship to be inferred between them.
  • Technically, a confounding variable Variable Variables represent information about something that can change. The design of the measurement scales, or of the methods for obtaining information, will determine the data gathered and the characteristics of that data. As a result, a variable can be qualitative or quantitative, and may be further classified into subgroups. Types of Variables is not a bias.
  • Confounds can be accounted for through proper study design. The following techniques help reduce the effect of confounds:
    • Randomization Randomization Epidemiological Studies: Subjects are randomly assigned to study groups so that confounds are spread equally between groups.
    • Controlling: All subjects are chosen so that they have the same confound.
    • Matching: Each subject with a confound in a particular group is matched to a subject in the other groups with the same or similar confound.   
  • Confounds are common in observational studies Observational studies Observational studies are used to observe and measure outcomes in a cohort with no control over risk factors or variables. They are often retrospective. Types of observational studies include cross-sectional studies, case-control studies, and cohort studies. Epidemiological Studies, as it is more difficult or impossible to control for confounding variables.
  • Confounding variables are different from effect modifiers, a third variable Variable Variables represent information about something that can change. The design of the measurement scales, or of the methods for obtaining information, will determine the data gathered and the characteristics of that data. As a result, a variable can be qualitative or quantitative, and may be further classified into subgroups. Types of Variables that contributes to the true relationship Relationship A connection, association, or involvement between 2 or more parties. Clinician–Patient Relationship between the exposure and outcome (see Table 2). 
Confounding bias

A diagram detailing how a confounding variable is related to the exposure and the outcome. The confound is related to the exposure and may contribute to or cause the outcome; if not accounted for, it can contribute to causing or affecting the magnitude of the observed (true) relationship.

Image by Lecturio.
Differences between confounders and effect modifiers
Confounders Effect modifiers
Masks associations Yes No
Creates the illusion Illusion The misinterpretation of a real external, sensory experience. Schizophrenia of association Yes No
Modifies the nature of the relationship Relationship A connection, association, or involvement between 2 or more parties. Clinician–Patient Relationship No Yes

Related videos

References

  1. Celentano, David D., ScD., M.H.S., & Szklo, Moyses, MD, M.P.H., DrP.H. (2019). More on causal inference: Bias, confounding, and interaction. In Celentano, David D., ScD, MHS, & Szklo, Moyses, MD, MPH, DrPH (Eds.), Gordis epidemiology (pp. 289-306). doi://dx.doi.org/10.1016/B978-0-323-55229-5.00015-2. Retrieved from https://www.clinicalkey.es/#!/content/3-s2.0-B9780323552295000152
  2. Althubaiti, A. (2016). Information bias in health research: Definition, pitfalls, and adjustment methods. Journal of Multidisciplinary Healthcare, 9(1), 211-217. doi:10.2147/JMDH.S104807. Retrieved from https://www.ncbi.nlm.nih.gov/pmc/articles/PMC4862344/
  3. Mansournia, M., Higgins, J. P., Sterne, J. A., & Hernán, M. (2017). Biases in randomized trials: A conversation between trialists and epidemiologists. Epidemiology, 28(1), 54-59. doi:10.1097/EDE.0000000000000564. Retrieved from https://www.ncbi.nlm.nih.gov/pmc/articles/PMC5130591/#S11title

Create your free account or log in to continue reading!

Sign up now and get free access to Lecturio with concept pages, medical videos, and questions for your medical education.

User Reviews

Details