Diagnostic tests are important aspects in making a diagnosis. Certain statistical information about the accuracy and validity Validity Validity refers to how accurate a test or research finding is. Causality, Validity, and Reliability of the tests themselves can help turn the data into usable, applicable information. Some of the most important epidemiological values of diagnostic tests include sensitivity and specificity, false positives and false negatives, positive and negative predictive values, likelihood ratios, and pre-test and post-test probabilities. For example, a test with high sensitivity is useful as a screening Screening Preoperative Care test, whereas high specificity is required for an accurate diagnosis. Alternatively, positive and negative predictive values help determine the probability Probability Probability is a mathematical tool used to study randomness and provide predictions about the likelihood of something happening. There are several basic rules of probability that can be used to help determine the probability of multiple events happening together, separately, or sequentially. Basics of Probability of disease in the case of certain test results.
Last updated: Dec 15, 2025
Screening Screening Preoperative Care tests are used to identify people in the early stages of a disease and enable early intervention with the goal of reducing morbidity Morbidity The proportion of patients with a particular disease during a given year per given unit of population. Measures of Health Status and mortality Mortality All deaths reported in a given population. Measures of Health Status.
Screening Screening Preoperative Care tests do not provide a definitive diagnosis:
The usefulness of screening Screening Preoperative Care tests requires assessment of:
Contingency tables are commonly used in the statistical analysis of multiple variables. To evaluate the epidemiologic value of a screening Screening Preoperative Care test, a table similar to that presented below can be used to determine the relative frequencies of individuals with different combinations of screening Screening Preoperative Care test results (positive or negative) and true disease state (truly have or do not have the disease).
It is important that the table is set up in a standard fashion in order for standard formulas to be applicable. The standard table is presented below (with screening Screening Preoperative Care test results on the left, true disease state on top, and “yes” answers before “no” answers).
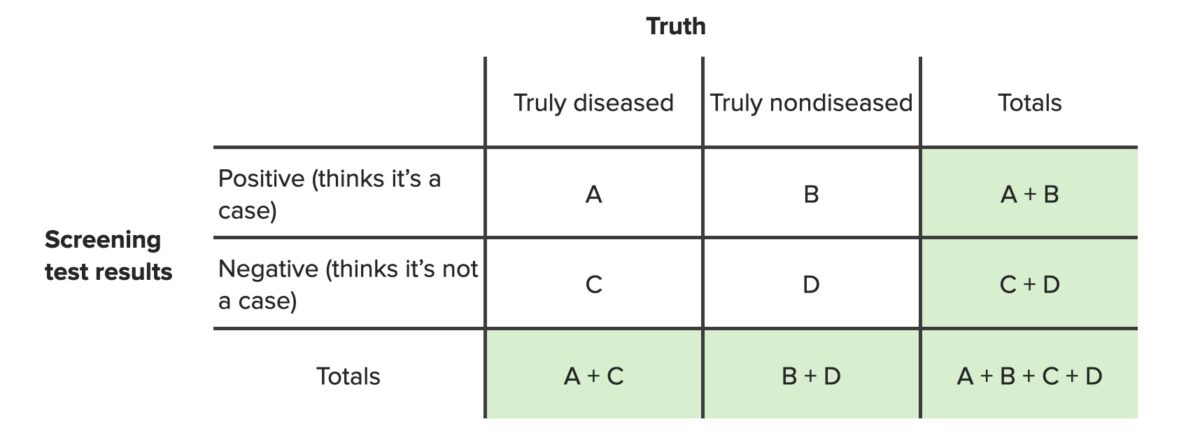
Contingency table for screening tests
Image by Lecturio. License: CC BY-NC-SA 4.0In this table:
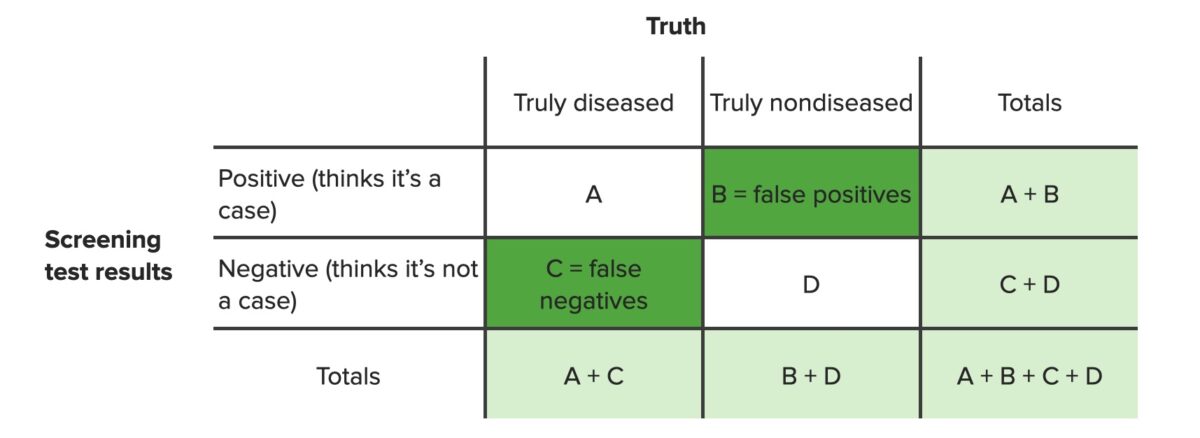
Contingency table identifying false positives (B) and false negatives (C)
Image by Lecturio. License: CC BY-NC-SA 4.0Sensitivity and specificity are measures used to assess the performance of screening Screening Preoperative Care and diagnostic tests.
Definition:
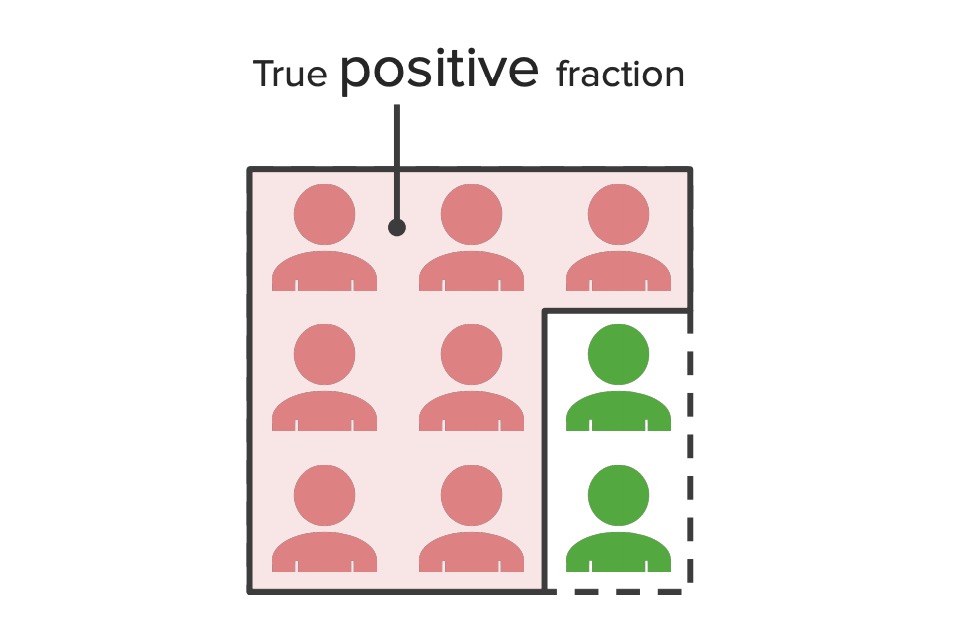
True positive fraction:
Diagram illustrating the concept of true positive fractions – the proportion of the population represented by the sensitivity of a test. This figure shows that all patients tested positive; however, the green figures represent individuals who did not have the disease but incorrectly tested positive (false positives). The red figures represent individuals who actually had the disease and also tested positive (true positives).
Calculations:
To calculate sensitivity, a 2×2 contingency table Contingency table A contingency table lists the frequency distributions of variables from a study and is a convenient way to look at any relationships between variables. Measures of Risk should be set up:

Contingency table for screening tests
Image by Lecturio. License: CC BY-NC-SA 4.0Sensitivity is the proportion of people who test positive on the screening Screening Preoperative Care test and have the disease (TPs, found in square A) divided by all the people who are truly diseased regardless of their screening Screening Preoperative Care test results (TPs and FNs, A + C). Sensitivity is represented by the following equation:
$$ Sensitivity = \frac{A}{A + C} $$Example: A new diagnostic test is evaluated on a group of patients Patients Individuals participating in the health care system for the purpose of receiving therapeutic, diagnostic, or preventive procedures. Clinician–Patient Relationship: 100 patients Patients Individuals participating in the health care system for the purpose of receiving therapeutic, diagnostic, or preventive procedures. Clinician–Patient Relationship are known to have the disease, and another 100 patients Patients Individuals participating in the health care system for the purpose of receiving therapeutic, diagnostic, or preventive procedures. Clinician–Patient Relationship are known to be disease free in a control group. Among them, 90 patients Patients Individuals participating in the health care system for the purpose of receiving therapeutic, diagnostic, or preventive procedures. Clinician–Patient Relationship with the disease and 20 individuals in the control group show a positive result. What is the sensitivity of the new test?
Answer: In this case, there were 100 patients Patients Individuals participating in the health care system for the purpose of receiving therapeutic, diagnostic, or preventive procedures. Clinician–Patient Relationship who were known to have the disease. Sensitivity is the proportion of these patients Patients Individuals participating in the health care system for the purpose of receiving therapeutic, diagnostic, or preventive procedures. Clinician–Patient Relationship who were correctly identified based on the positive test. Set up a contingency table Contingency table A contingency table lists the frequency distributions of variables from a study and is a convenient way to look at any relationships between variables. Measures of Risk as follows:
| Diseased | Control group | Total | |
|---|---|---|---|
| Positive test | 90 | 20 | 110 |
| Negative test | 10 | 80 | 90 |
| Total | 100 | 100 | 200 |
Importance of sensitivity:
Definition:
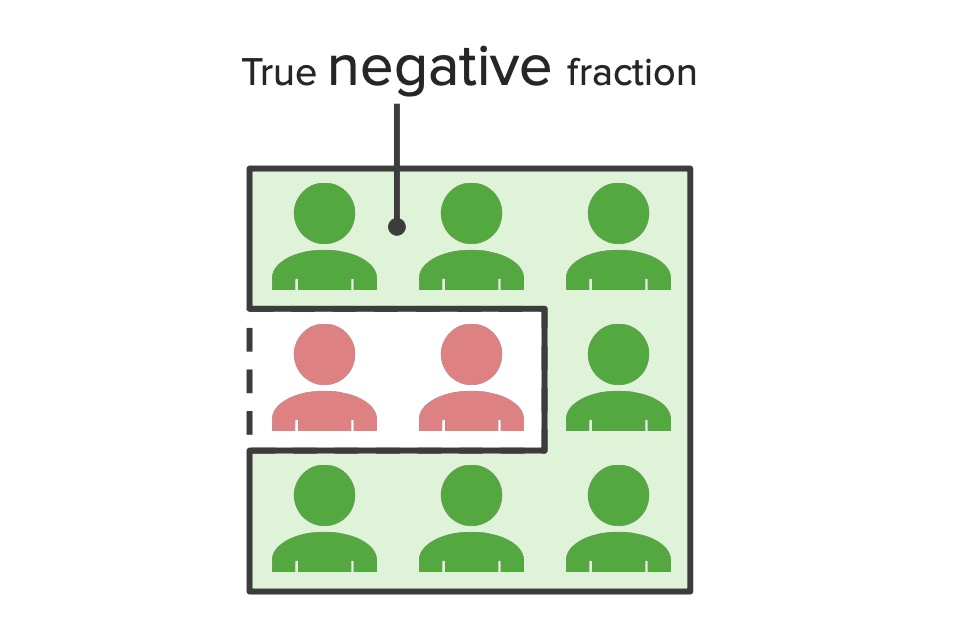
True negative fraction:
Diagram illustrating the concept of true negative fractions – the proportion of the population represented by the specificity of a test. This diagram shows that all patients received a negative test result. The red figures represent individuals who actually had the disease but tested negative (false negatives), whereas the green figures represent individuals who did not have the disease and correctly tested negative (true negatives).
Calculation:
Specificity is also calculated using a similar contingency table Contingency table A contingency table lists the frequency distributions of variables from a study and is a convenient way to look at any relationships between variables. Measures of Risk:

Contingency table for screening tests
Image by Lecturio. License: CC BY-NC-SA 4.0Specificity is the proportion of people who are truly negative and have a negative screening Screening Preoperative Care test (TNs, found in square D) divided by all people who are truly negative, regardless of their screening Screening Preoperative Care test results (TNs and FPs, B + D). Specificity is represented by the following equations:
$$ Specificity = \frac{D}{B + D}\ or \ Specificity = \frac{TN}{(FP + TN)} $$where TN = true negatives and FP= false positives
Example: A new diagnostic test is tested on a group of patients Patients Individuals participating in the health care system for the purpose of receiving therapeutic, diagnostic, or preventive procedures. Clinician–Patient Relationship: 100 patients Patients Individuals participating in the health care system for the purpose of receiving therapeutic, diagnostic, or preventive procedures. Clinician–Patient Relationship are known to have the disease, and another 100 patients Patients Individuals participating in the health care system for the purpose of receiving therapeutic, diagnostic, or preventive procedures. Clinician–Patient Relationship are known to be disease free in a control group. Among them, 90 patients Patients Individuals participating in the health care system for the purpose of receiving therapeutic, diagnostic, or preventive procedures. Clinician–Patient Relationship with the disease and 20 individuals in the control group show a positive result. What is the specificity of the new test?
Answer: In this case, all patients Patients Individuals participating in the health care system for the purpose of receiving therapeutic, diagnostic, or preventive procedures. Clinician–Patient Relationship in the control group are known to be disease free. Specificity is the proportion of these patients Patients Individuals participating in the health care system for the purpose of receiving therapeutic, diagnostic, or preventive procedures. Clinician–Patient Relationship who were correctly identified based on the negative test. Set up a contingency table Contingency table A contingency table lists the frequency distributions of variables from a study and is a convenient way to look at any relationships between variables. Measures of Risk as follows:
| Diseased | Control group | Total | |
|---|---|---|---|
| Positive test | 90 | 20 | 110 |
| Negative test | 10 | 80 | 90 |
| Total | 100 | 100 | 200 |
Importance of specificity:
Predictive values are also called “precision rates.”
Definition:
The positive predictive value is the percentage of people with a positive test result who actually have the disease among all people with a positive result (A), regardless of whether or not they have the disease (A+B).
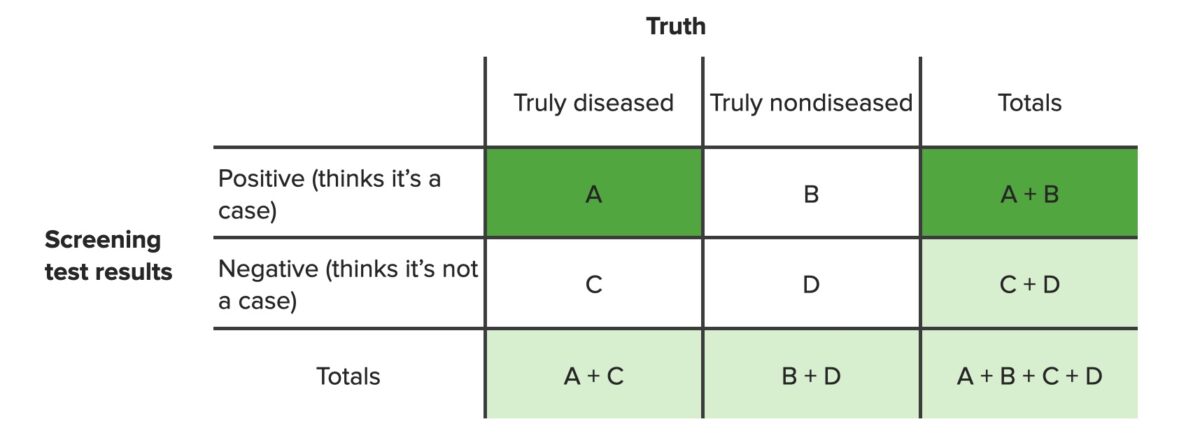
Contingency table highlighting the values needed for the computation of positive predictive value
Image by Lecturio. License: CC BY-NC-SA 4.0Calculation:
The positive predictive value is calculated using the equation:
$$ Positive\ predictive\ value = \frac{A}{A + B} $$where A = true positives and B = false positives
Example: A new diagnostic test is tested on a group of patients Patients Individuals participating in the health care system for the purpose of receiving therapeutic, diagnostic, or preventive procedures. Clinician–Patient Relationship: 100 patients Patients Individuals participating in the health care system for the purpose of receiving therapeutic, diagnostic, or preventive procedures. Clinician–Patient Relationship are known to have the disease, and another 100 patients Patients Individuals participating in the health care system for the purpose of receiving therapeutic, diagnostic, or preventive procedures. Clinician–Patient Relationship are known to be disease free in a control group. Among them, 90 patients Patients Individuals participating in the health care system for the purpose of receiving therapeutic, diagnostic, or preventive procedures. Clinician–Patient Relationship with the disease and 20 individuals in the control group show a positive result. What is the positive predictive value of the new test?
Answer: The positive predictive value is asking about the proportion of TP cases out of all positive cases (TP + FP). Set up a contingency table Contingency table A contingency table lists the frequency distributions of variables from a study and is a convenient way to look at any relationships between variables. Measures of Risk as follows:
| Diseased | Control group | Total | |
|---|---|---|---|
| Positive test | 90 | 20 | 110 |
| Negative test | 10 | 80 | 90 |
| Total | 100 | 100 | 200 |
Difference between positive predictive value and sensitivity:
Definition:
The NPV is the percentage of people with a negative test result who are actually disease free (D), among all people with a negative result (regardless of whether or not they have the disease, C + D).
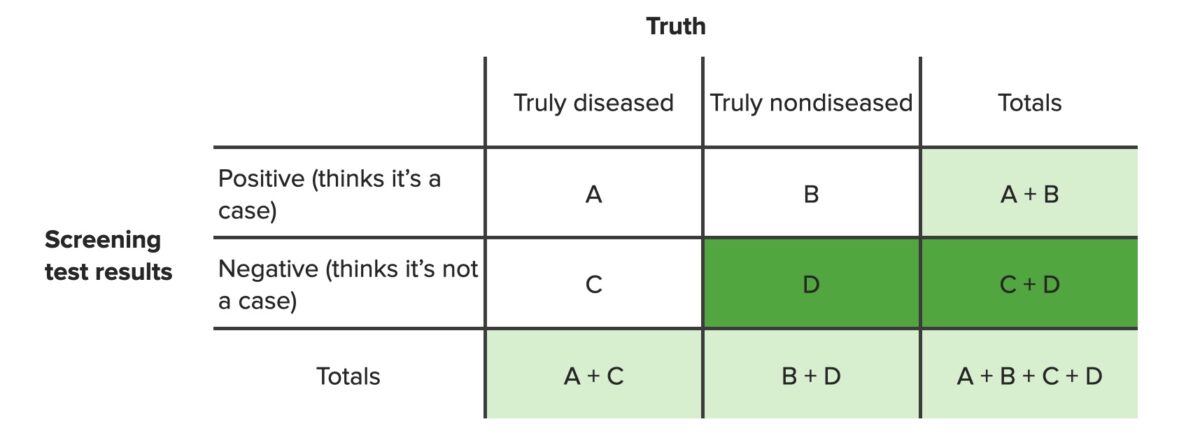
Contingency table highlighting the values needed to compute negative predictive value
Image by Lecturio. License: CC BY-NC-SA 4.0Calculation:
The NPV is calculated using the following equation:
$$ NPV = \frac{D}{C + D} $$where D = true negatives and C = false negatives
Example: A new diagnostic test is tested on a group of patients Patients Individuals participating in the health care system for the purpose of receiving therapeutic, diagnostic, or preventive procedures. Clinician–Patient Relationship: 100 patients Patients Individuals participating in the health care system for the purpose of receiving therapeutic, diagnostic, or preventive procedures. Clinician–Patient Relationship are known to have the disease, and another 100 patients Patients Individuals participating in the health care system for the purpose of receiving therapeutic, diagnostic, or preventive procedures. Clinician–Patient Relationship are known to be disease free in a control group. Among them, 90 patients Patients Individuals participating in the health care system for the purpose of receiving therapeutic, diagnostic, or preventive procedures. Clinician–Patient Relationship with the disease and 20 individuals in the control group show a positive result. What is the NPV of the new test?
Answer: The NPV is asking about the proportion of TN cases out of all negative cases (TN + FN). Set up a contingency table Contingency table A contingency table lists the frequency distributions of variables from a study and is a convenient way to look at any relationships between variables. Measures of Risk as follows:
| Diseased | Control group | Total | |
|---|---|---|---|
| Positive test | 90 | 20 | 110 |
| Negative test | 10 | 80 | 90 |
| Total | 100 | 100 | 200 |
Difference between NPV and specificity:
Pregnancy Pregnancy The status during which female mammals carry their developing young (embryos or fetuses) in utero before birth, beginning from fertilization to birth. Pregnancy: Diagnosis, Physiology, and Care example:
In a study, 4,810 women take a home urine pregnancy Pregnancy The status during which female mammals carry their developing young (embryos or fetuses) in utero before birth, beginning from fertilization to birth. Pregnancy: Diagnosis, Physiology, and Care test. All of them undergo an ultrasound to confirm whether or not they are truly pregnant. Among them, 9 women have a positive urine pregnancy Pregnancy The status during which female mammals carry their developing young (embryos or fetuses) in utero before birth, beginning from fertilization to birth. Pregnancy: Diagnosis, Physiology, and Care test result and are actually found to be pregnant on ultrasound; 1 woman has a negative urine pregnancy Pregnancy The status during which female mammals carry their developing young (embryos or fetuses) in utero before birth, beginning from fertilization to birth. Pregnancy: Diagnosis, Physiology, and Care test result but is actually pregnant; 351 women have positive urine pregnancy Pregnancy The status during which female mammals carry their developing young (embryos or fetuses) in utero before birth, beginning from fertilization to birth. Pregnancy: Diagnosis, Physiology, and Care test results and are found to not be pregnant; 4,449 women have negative urine pregnancy Pregnancy The status during which female mammals carry their developing young (embryos or fetuses) in utero before birth, beginning from fertilization to birth. Pregnancy: Diagnosis, Physiology, and Care test results and ultrasound results confirm that they are not pregnant. (Note: This is sample data and does not represent real values.)
In this example, the home pregnancy Pregnancy The status during which female mammals carry their developing young (embryos or fetuses) in utero before birth, beginning from fertilization to birth. Pregnancy: Diagnosis, Physiology, and Care test is the screening Screening Preoperative Care test, and “ pregnancy Pregnancy The status during which female mammals carry their developing young (embryos or fetuses) in utero before birth, beginning from fertilization to birth. Pregnancy: Diagnosis, Physiology, and Care” is the “disease” state.
The contingency table Contingency table A contingency table lists the frequency distributions of variables from a study and is a convenient way to look at any relationships between variables. Measures of Risk is as follows:
| Pregnant | Not pregnant | Total | |
|---|---|---|---|
| Positive test | 9 | 351 | 360 |
| Negative test | 1 | 4,449 | 4,450 |
| Total | 10 | 4,800 | 4,810 |
| Clinical question | What is being asked? | Equation | Answer |
|---|---|---|---|
| If the woman is actually pregnant, what is the probability Probability Probability is a mathematical tool used to study randomness and provide predictions about the likelihood of something happening. There are several basic rules of probability that can be used to help determine the probability of multiple events happening together, separately, or sequentially. Basics of Probability that the urine pregnancy Pregnancy The status during which female mammals carry their developing young (embryos or fetuses) in utero before birth, beginning from fertilization to birth. Pregnancy: Diagnosis, Physiology, and Care test will be positive? | Sensitivity | = A / (A + C)
= 9 / (10) |
90% |
| If a woman is not actually pregnant, what is the probability Probability Probability is a mathematical tool used to study randomness and provide predictions about the likelihood of something happening. There are several basic rules of probability that can be used to help determine the probability of multiple events happening together, separately, or sequentially. Basics of Probability that the urine pregnancy Pregnancy The status during which female mammals carry their developing young (embryos or fetuses) in utero before birth, beginning from fertilization to birth. Pregnancy: Diagnosis, Physiology, and Care test will correctly show that she is not pregnant? | Specificity | = B / (B + D)
= 4,449 / 4,800 |
92.7% |
| If a woman tests positive in the urine pregnancy Pregnancy The status during which female mammals carry their developing young (embryos or fetuses) in utero before birth, beginning from fertilization to birth. Pregnancy: Diagnosis, Physiology, and Care test, what is the probability Probability Probability is a mathematical tool used to study randomness and provide predictions about the likelihood of something happening. There are several basic rules of probability that can be used to help determine the probability of multiple events happening together, separately, or sequentially. Basics of Probability that she is actually pregnant? | positive predictive value | = A / (A + B)
= 9 / 360 |
2.5% |
| If a woman tests negative in the urine pregnancy Pregnancy The status during which female mammals carry their developing young (embryos or fetuses) in utero before birth, beginning from fertilization to birth. Pregnancy: Diagnosis, Physiology, and Care test, what is the probability Probability Probability is a mathematical tool used to study randomness and provide predictions about the likelihood of something happening. There are several basic rules of probability that can be used to help determine the probability of multiple events happening together, separately, or sequentially. Basics of Probability that she really is not pregnant? | NPV | = D / (C + D)
= 4,449 / 4,450 |
99.9% |
Using the same pregnancy Pregnancy The status during which female mammals carry their developing young (embryos or fetuses) in utero before birth, beginning from fertilization to birth. Pregnancy: Diagnosis, Physiology, and Care example in the section above, and knowing that the sensitivity was 90% and the specificity was 92.7%, the LR+ and LR‒ can be computed as follows:
LR+ = 0.9 / (1 ‒ 0.927) = 12.3 = 1,230%
LR‒ = (1 ‒ 0.9) / 0.927 = 0.11 = 11%
Interpretation: There is a 12-fold greater likelihood that a woman who tests positive is truly pregnant. A negative test result reduces the odds of being pregnant by 89%.